IMAGE

Figure 5

ID
ZDB-IMAGE-221031-147
Source
Figures for Farhan et al., 2022
Image
Figure Caption

Figure 5

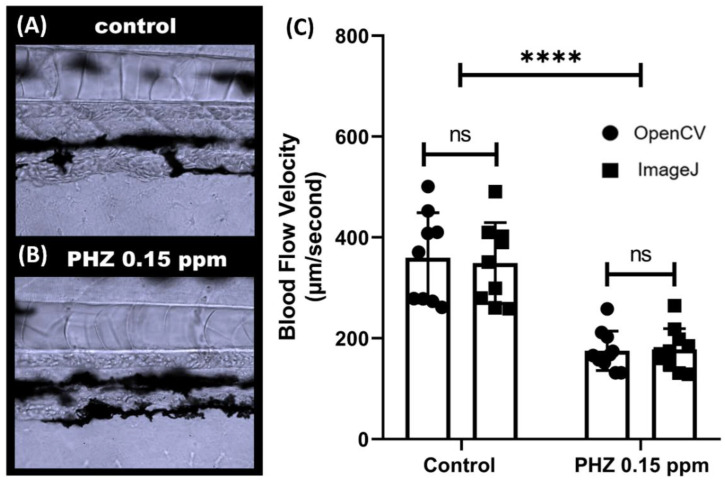
Validation of OpenBloodFlow method through comparison with ImageJ performance for blood flow velocity measurement in zebrafish larvae after exposure to control (A) and 0.15 ppm PHZ (Phenylhydrazine) (B). PHZ exposure significantly reduced the blood flow velocity in zebrafish larvae. (C) Side-by-side comparison of the average blood flow velocity measurement by ImageJ and OpenCV methods. The data were presented as mean with standard deviation, and statistical significance was determined by paired t-test for intra-group comparison or unpaired t-test for inter-group comparison. (ns = no significance, **** p < 0.0001, n = 10) (circle dots show the data analyzed by OpenCV, while square dots show the data analyzed by ImageJ).

Acknowledgments
This image is the copyrighted work of the attributed author or publisher, and ZFIN has permission only to display this image to its users. Additional permissions should be obtained from the applicable author or publisher of the image. Full text @ Biology (Basel)