
Image
|
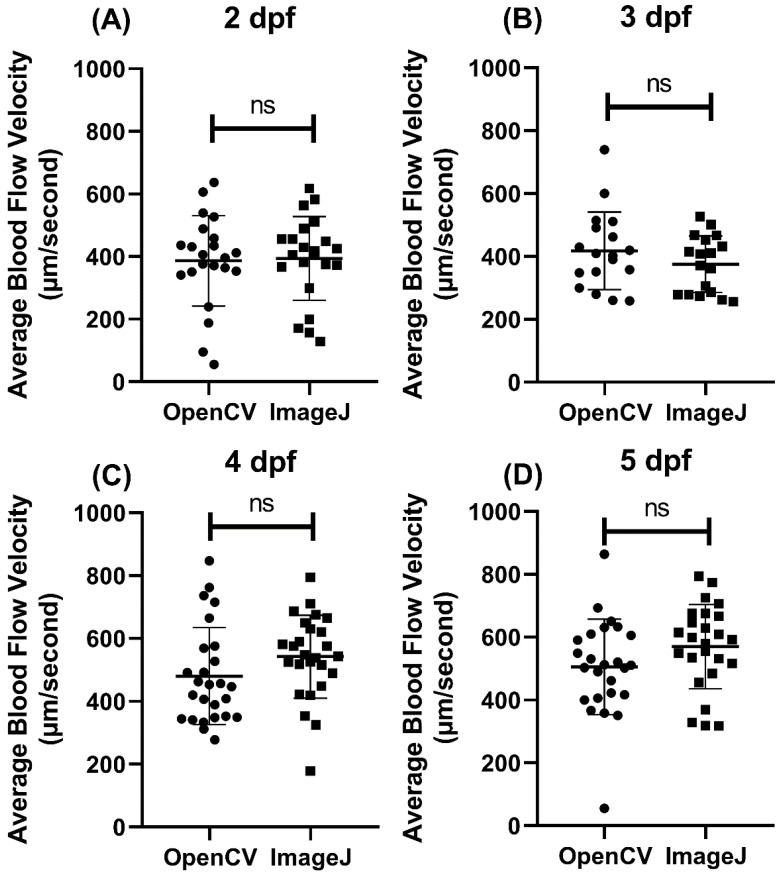
Figure Caption
Figure 4
Validation of the performance of OpenBloodFlow GUI package for blood flow velocity measurement through comparison with ImageJ method. Zebrafish embryos aged (
Acknowledgments
This image is the copyrighted work of the attributed author or publisher, and
ZFIN has permission only to display this image to its users.
Additional permissions should be obtained from the applicable author or publisher of the image.
Full text @ Biology (Basel)