IMAGE

Figure 1

ID
ZDB-IMAGE-221031-142
Source
Figures for Farhan et al., 2022
Image
Figure Caption

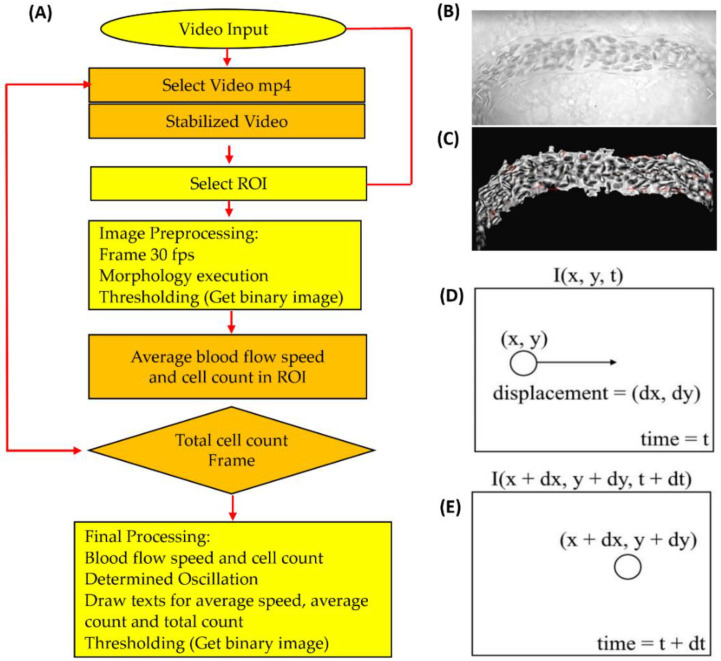
Figure 1

The overall scheme for blood flow velocity and blood cell count in zebrafish and medaka. (A) Overview of the entire analysis pipeline for blood flow measurement in fish embryos by OpenCV. (B) Shaky video footage of a fish blood vessel. (C) After performing video stabilization, the masked area presented for smooth oscillation. The motion illustration in estimating optical flow was applied using the Gunnar Farneback method by OpenCV at time = t (D) and time = t + dt (E).

Acknowledgments
This image is the copyrighted work of the attributed author or publisher, and ZFIN has permission only to display this image to its users. Additional permissions should be obtained from the applicable author or publisher of the image. Full text @ Biology (Basel)