
Image
|
Figure Caption
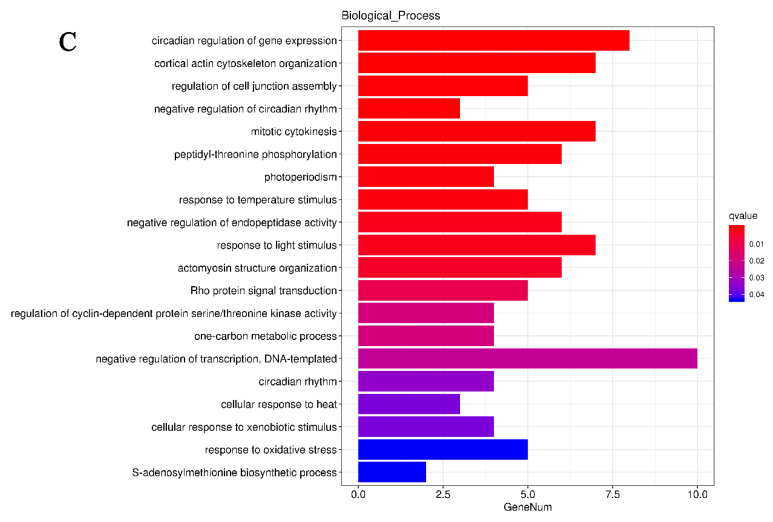
Figure 5 GO functional enrichment analysis of differentially expressed genes in the liver. Histograms of GO term enrichment in the (A) cellular component category, (B) molecular function category, and (C) biological process category.
Acknowledgments
This image is the copyrighted work of the attributed author or publisher, and
ZFIN has permission only to display this image to its users.
Additional permissions should be obtained from the applicable author or publisher of the image.
Full text @ Animals (Basel)