
Image
|
Figure Caption
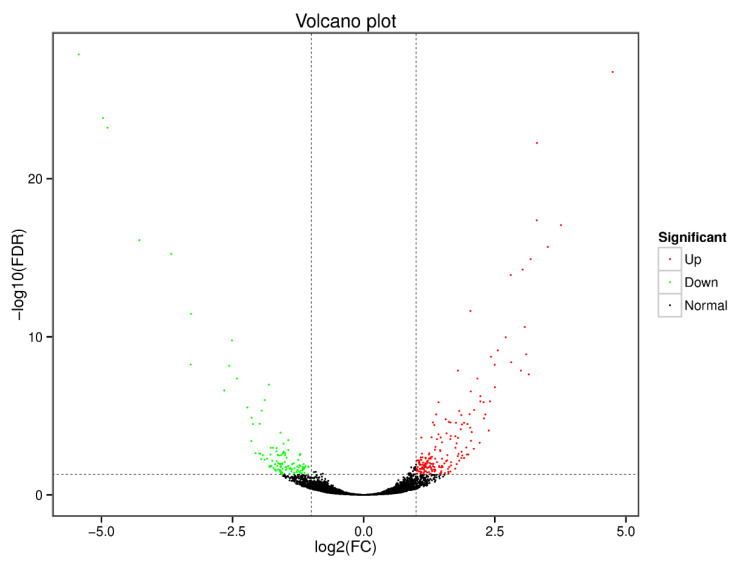
Figure 3
Volcano plot of differential gene expression in the zebrafish liver. Green dots represent down-regulated genes in the 1% Aurantiochytrium sp. extract group, red dots represent up-regulated genes, and black dots represent non-differentially expressed genes. Significance criteria were q < 0.05 and fold change ≥ 2.
Acknowledgments
This image is the copyrighted work of the attributed author or publisher, and
ZFIN has permission only to display this image to its users.
Additional permissions should be obtained from the applicable author or publisher of the image.
Full text @ Animals (Basel)