
Fig. 2.
- ID
- ZDB-IMAGE-221031-10
- Publication
- Boezio et al., 2022 - The developing epicardium regulates cardiac chamber morphogenesis by promoting cardiomyocyte growth
- All Figures
- Figures for Boezio et al., 2022
|
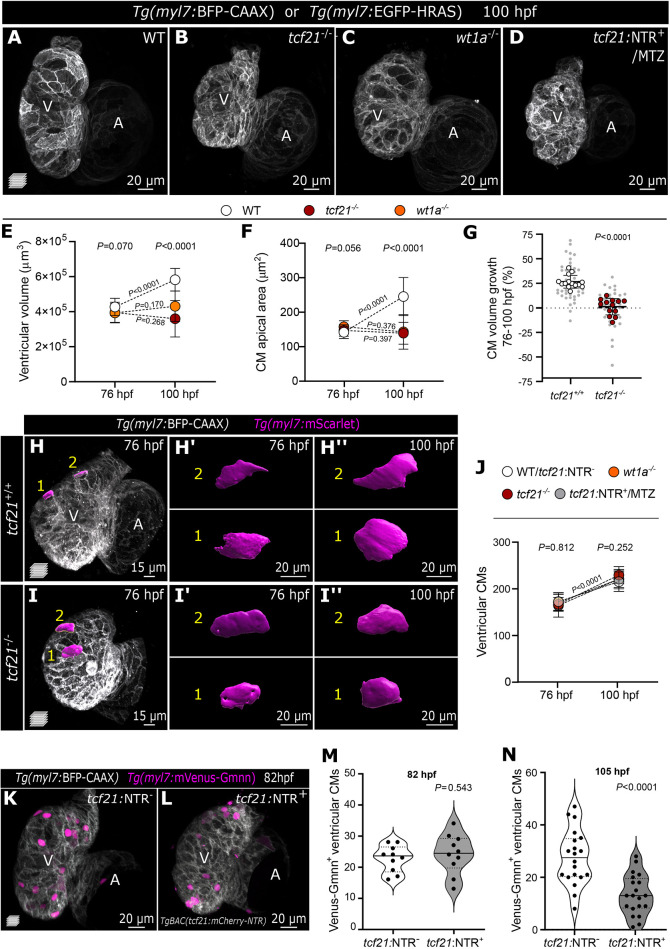
Fig. 2.
Impaired epicardial coverage affects ventricular cardiomyocyte size increase and ventricular growth. (A-D) Confocal images of 100 hpf WT, tcf21−/−, wt1a−/− and TgBAC(tcf21:mCherry-NTR)+ (tcf21:NTR+) MTZ-treated larvae, exhibiting reduced ventricular size. (E,F) Change in ventricular volume (E) and CM apical area (F) from 76 to 100 hpf in WT, tcf21−/− and wt1a−/− larvae. (G) Percentage increase of individual CM volume between 76 and 100 hpf, measured by the myl7:mScarlet signal. Large dots indicate the average per larva and small dots indicate individual CMs. P-values were determined from unpaired two-tailed t-test comparing the averages per larva. (H-I″) Confocal images of Tg(myl7:BFP-CAAX); tcf21+/+ or tcf21−/− larva at 76 and 100 hpf (same larvae shown), injected with myl7:mScarlet DNA to label individual CMs. (H′-I″) 3D surface rendering of individual CMs at the two time points. (J) Changes in ventricular CM numbers from 76 to 100 hpf in WT (or tcf21:NTR−), tcf21−/−, wt1a−/− and tcf21:NTR+-MTZ treated larvae. (K-N) Confocal images and quantification of myl7:mVenus-Gmnn+ CMs in 82 hpf (K-M) and 105 hpf (N) control (tcf21:NTR−) and tcf21:NTR+ MTZ-treated larvae. P-values (M,N) were determined by unpaired two-tailed t-test. Data show the mean±s.d. (E,F,G,J), and the solid and dotted lines (M,N) indicate the median and quartiles, respectively. P-values from one-way ANOVA among the three different genotypes at the same time point are shown above the graph (E,F,J), or from unpaired two-tailed t-test comparing the two different time points within the same genotype are shown on the dotted lines (E,F,J). Single data points are shown in Fig. S2. WT, wild type; A, atrium; V, ventricle.