
Image
|
Figure Caption
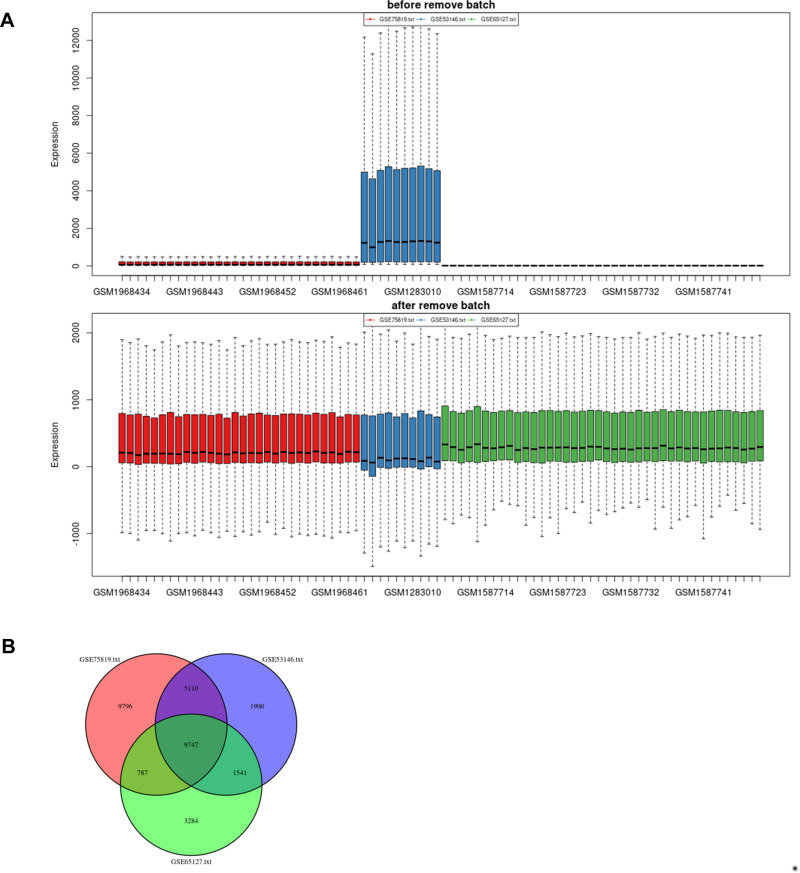
Fig. 2 Batch effects elimination and Venn plot. (A) Batch effects elimination of datasets GSE65127, GSE53146 and GSE75819. (B) Venn plot revealed the number of overlapping genes among the three datasets.
Acknowledgments
This image is the copyrighted work of the attributed author or publisher, and
ZFIN has permission only to display this image to its users.
Additional permissions should be obtained from the applicable author or publisher of the image.
Full text @ Clin Cosmet Investig Dermatol