
Fig. 2
- ID
- ZDB-IMAGE-221030-53
- Publication
- Gunasekharan et al., 2021 - Preliminary Insight of Pyrrolylated-Chalcones as New Anti-Methicillin-Resistant Staphylococcus aureus (Anti-MRSA) Agents
- All Figures
- Figures for Gunasekharan et al., 2021
|
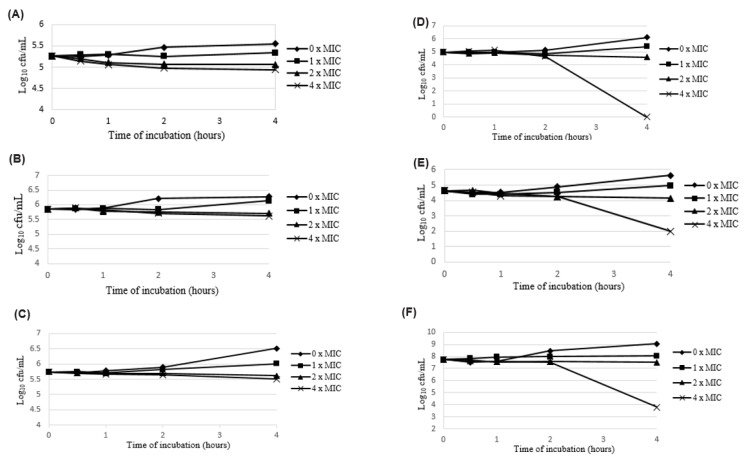
Fig. 2
Time-kill curve of MRSA ATCC 700699 after exposure to (A) compound 8 and (B) compound 9 at 0× MIC (0 mg/mL), 1× MIC (0.156 mg/mL), 2× MIC (0.313 mg/mL), and 4× MIC (0.625 mg/mL), as well as (C) compound 10 at 0× MIC (0 mg/mL), 1× MIC (0.313 mg/mL), 2× MIC (0.625 mg/mL), and 4× MIC (1.25 mg/mL). Time-kill curve of clinical MRSA 172918 after exposure to (D) compound 8 at 0× MIC (0 mg/mL), 1× MIC (0.078 mg/mL), 2× MIC (0.156 mg/mL), and 4× MIC (0.312 mg/mL), (E) compound 9 at 0× MIC (0 mg/mL), 1× MIC (0.156 mg/mL), 2× MIC (0.313 mg/mL), and 4× MIC (0.625 mg/mL), and (F) compound 10 at 0× MIC (0 mg/mL), 1× MIC (0.313 mg/mL), 2× MIC (0.625 mg/mL), and 4× MIC (1.25 mg/mL).