IMAGE

Fig. 4

ID
ZDB-IMAGE-221026-33
Source
Figures for Müller et al., 2022
Image
Figure Caption

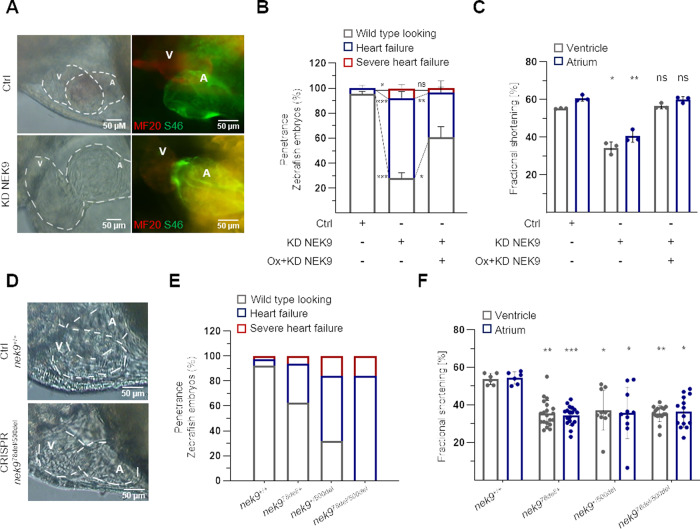
Fig. 4 Functional analysis of NEK9 in-vivo.

A Lateral view of zebrafish embryo hearts 72 h post fertilization (hpf) injected with control oligonucleotides or anti-sense oligonucleotides blocking the translational start site of nek9 (KD NEK9) (left). Immunostaining of atrium-specific (A) and ventricle-specific (V) myosin heavy chains (green: antibody against atrial-specific myosin (S46), red: antibody against ventricular and atrial myosin (MF20)) (right). B Phenotype rescue of KD NEK9. Zebrafish eggs were injected with nek9 mRNA (Ox + KD NEK9) followed by KD NEK9 in one-cell stage. Analysis was performed at 72 hpf. Data are mean ± SD (Ctrl, n = 143; KD NEK9, n = 192; Ox + KD NEK9, n = 155 fish embryos out of 3 experiments). *P < 0.05; **P < 0.01; ***P < 0.001 by the analysis of two-tailed paired Student’s t-test. C Fractional shortening (FS) of zebrafish morphants at 72 hpf. Data are mean ± SD (Ctrl, n = 25; KD NEK9, n = 21; Ox + KD NEK9, n = 21 fish embryos out of 3 experiments). *P < 0.05; **P < 0.01 by the analysis of two-way ANOVA followed by Bonferroni’s multiple comparisons test. The respective heart rate is shown in Supplementary Fig. 4ADF Two heterozygous transgenic zebrafish lines were generated by CRISPR/Cas9. Heterozygous transgenic zebrafish nek978del/+ and nek9+/500del (F1 parents) were incrossed and F2 generation was analyzed at 72 hpf regarding heart morphology (D), penetrance of heart failure phenotype (E) and FS (F). Recordings were performed for all embryos showing a heart failure phenotype compared to randomly chosen wild type looking littermates. After phenotype analysis all embryos were genotyped as shown in Supplementary Fig. 5B and genotypes were associated to phenotypes (total number of genotype (number of phenotype: wild type looking/heart failure/severe heart failure): nek9+/+, n = 77 (71/4/2); nek978del/+, n = 64 (40/20/4); nek9+/500del, n = 19 (6/10/3); nek978del/500del, n = 19 (0/16/3)). Statistical significance in F was calculated by a mixed effect model followed by Bonferroni’s multiple comparisons test. *P < 0.05; **P < 0.01; ***P < 0.001 are shown for the corresponding chamber of Ctrl embryos.

Acknowledgments
This image is the copyrighted work of the attributed author or publisher, and ZFIN has permission only to display this image to its users. Additional permissions should be obtained from the applicable author or publisher of the image. Full text @ Nat. Commun.