
|
Figure 3
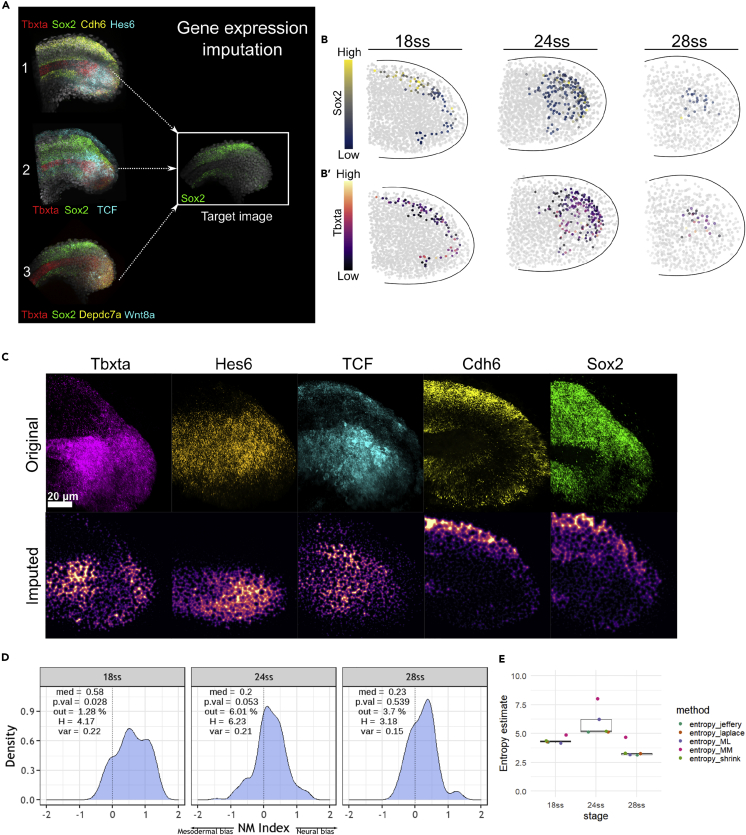
Gene expression imputation and the construction of a composite map via ZebReg demonstrates a peak in the NM index entropy at 24ss
(A) Application of ZebReg for the imputation of multiple genes onto a target composite image. In the panel, tbxta, cdh6, hes6, tcf, depdc7a and wnt8a are imputed onto a target image that is stained only for sox2. sox2 is the common color channel used to assist the alignment of the source images onto the target image. In this example, the resultant target image has 7 distinct color channels.
(B–B′) Coloring in silico NMps in the 18ss, 24 and 28ss composite maps by (B) sox2 expression (B′) tbxta expression levels.
(C) The top ‘Original’ row depicts the 2D projections of the HCR data at 18ss. The bottom ‘Imputed’ row depicts the corresponding expression of these genes in the target composite image.
(D) NM index density distributions computed from the 8-gene composite maps at 18ss, 24 and 28ss. Negative values of the NM index indicate mesodermal bias, whereas positive values indicate neural bias. med: median; p.val: pvalue for the Shapiro-Wilk test; out: outlier percentage; H: empirical entropy estimate; var: variance.
(E) Entropy estimates of the NMp index, with the estimation of the SE obtained via jackknife resampling. The entropy estimates consistently peak at 24ss. entropy_jeffrey: Dirichlet-multinomial pseudocount entropy estimator (Dirichlet) with Jeffrey’s prior; entropy_laplace: Dirichlet with Laplace’s prior; entropy_ML: empirical maximum likelihood estimator; entropy_MM: Miller-Madow estimator; entropy_shrink: James-Steintype shrinkage estimator.