
|
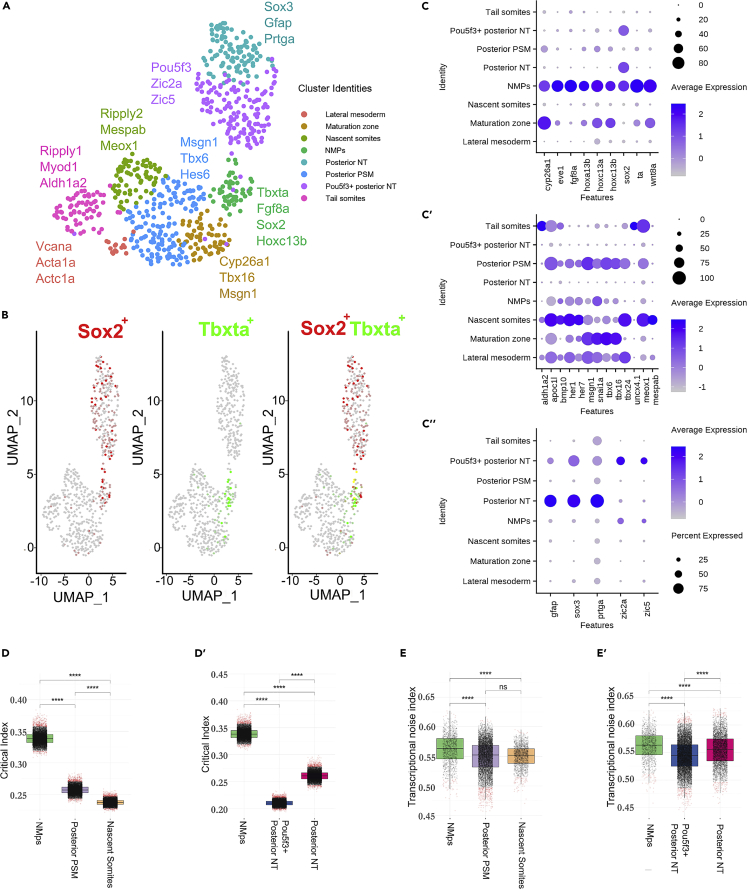
Figure 2
Analysis of 18ss scRNA-seq data reveals a peak in the critical index and transcriptional noise index in the NMp population relative to its derivatives
(A) UMAP embedding showing the 8 tailbud clusters at 18ss alongside the key differentially expressed genes used for manual annotation. UMAP: uniform manifold approximation and projection.
(B) UMAP embedding in (A) colored by sox2 and tbxta expression and sox2-tbxta together to illustrate co-expression (in yellow).
(C–C″) Dot plots displaying the expression of differentially expressed genes from the tailbud (C) NMp cluster, (C′) Mesodermal clusters and (C″) Neural clusters.
(D–D′) Distribution of the critical transition index Ic calculated using marker genes of each cluster along the mesodermal (D) and neural (D′) branches. A bootstrapping procedure was applied in calculating Ic to account for the differences in cell number between cell clusters. Wilcoxon-Mann-Whitney unpaired two-sample test ∗∗∗∗p value < 0.0001; ns, not significant.
(E–E′) Distribution of pairwise cell-to-cell distances/transcriptional noise along the mesodermal (E) and neural (E′) branches. Wilcoxon-Mann-Whitney unpaired two-sample test ∗∗∗∗p value < 0.0001; ns, not significant.