
|
Figure 1
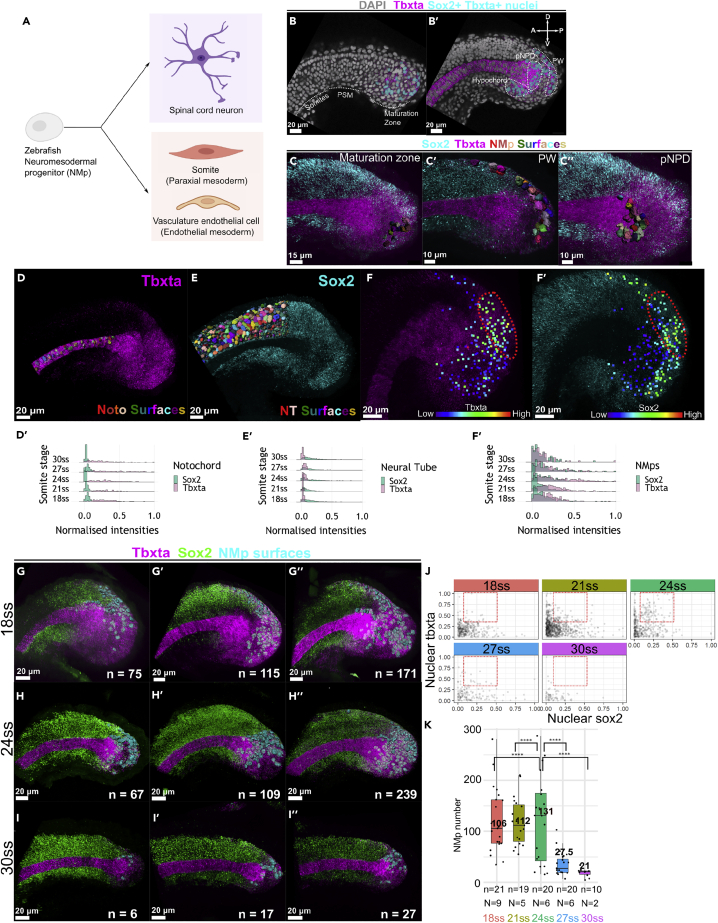
Heterogeneity in sox2 and tbxta expression and variability in the number and locations of NMps peak at 24ss
(A) Zebrafish NMps undertake a binary fate decision to differentiate into the posterior neural and mesodermal fates.
(B) 2D lateral slice showing sox2+tbxta+ nuclei (cyan surfaces) in the maturation zone.
(B′) 2D medial slice showing sox2+tbxta+ nuclei in the hypochord, pNPD and PW. pNPD: posterior notochord progenitor domain; PW: posterior wall.
(C–C″) Segmented NMp surfaces located in the (C) maturation zone (C′) PW (C″) pNPD.
(D, E, and F–F′) Maximum intensity projections of tbxta and sox2 shown alongside segmented surfaces of the posterior notochord (D) and posterior neural tube (E). NMps are shown as points colored according to their (F) tbxta and (F′) sox2 expression levels. The red regions highlight the NMps in the posterior wall that co-express intermediate levels of (F′) tbxta and (F″) sox2, which is also highlighted with a red region in (J).
(D′, E′, and F″) Histograms from 18ss to 30ss depicting the expression distributions of nuclear sox2 and tbxta distributions in the (D′) posterior notochord (E′) posterior neural tube (F′) NMp populations. Each ridge plot displays the expression distributions of the specified cell population across all analyzed samples. All three cell populations within a sample adopted the same Sox2 and Tbxta threshold value for min-max normalization (STAR methods: Quantification and normalization of nuclear gene expression intensities in NMps).
(G–I″) HCR-stained samples at (G-G″) 18ss, (H–H″) 24ss and (I–I″) 30ss with three representative images per set. n: number of segmented NMps in each sample.
(J) Scatterplots of sox2 and tbxta expression of NMps from 18ss to 30ssat three-somite intervals. Each point corresponds to the normalised nuclear sox2 and tbxta intensities of a single NMp. The red boxes at each stage highlight NMps with intermediate levels of both genes.
(K) Box and whisker plots of the number of NMps from 18ss to 30ssat three-somite intervals. Each point corresponds to the number of NMps in a single sample. The median NMp number is indicated in bold. n: total number of samples analyzed for each stage (biological replicate). N: number of distinct imaging experiments, where different biological samples imaged on the same day are considered a single imaging experiment. Levene’s test for the equality of variance was carried out for the NMp numbers at 24ss against the other four timepoints. ∗pvalue < 0.01.