
Figure 5.
- ID
- ZDB-IMAGE-221018-174
- Publication
- Jimenez et al., 2022 - A regulatory network of Sox and Six transcription factors initiate a cell fate transformation during hearing regeneration in adult zebrafish
- All Figures
- Figures for Jimenez et al., 2022
|
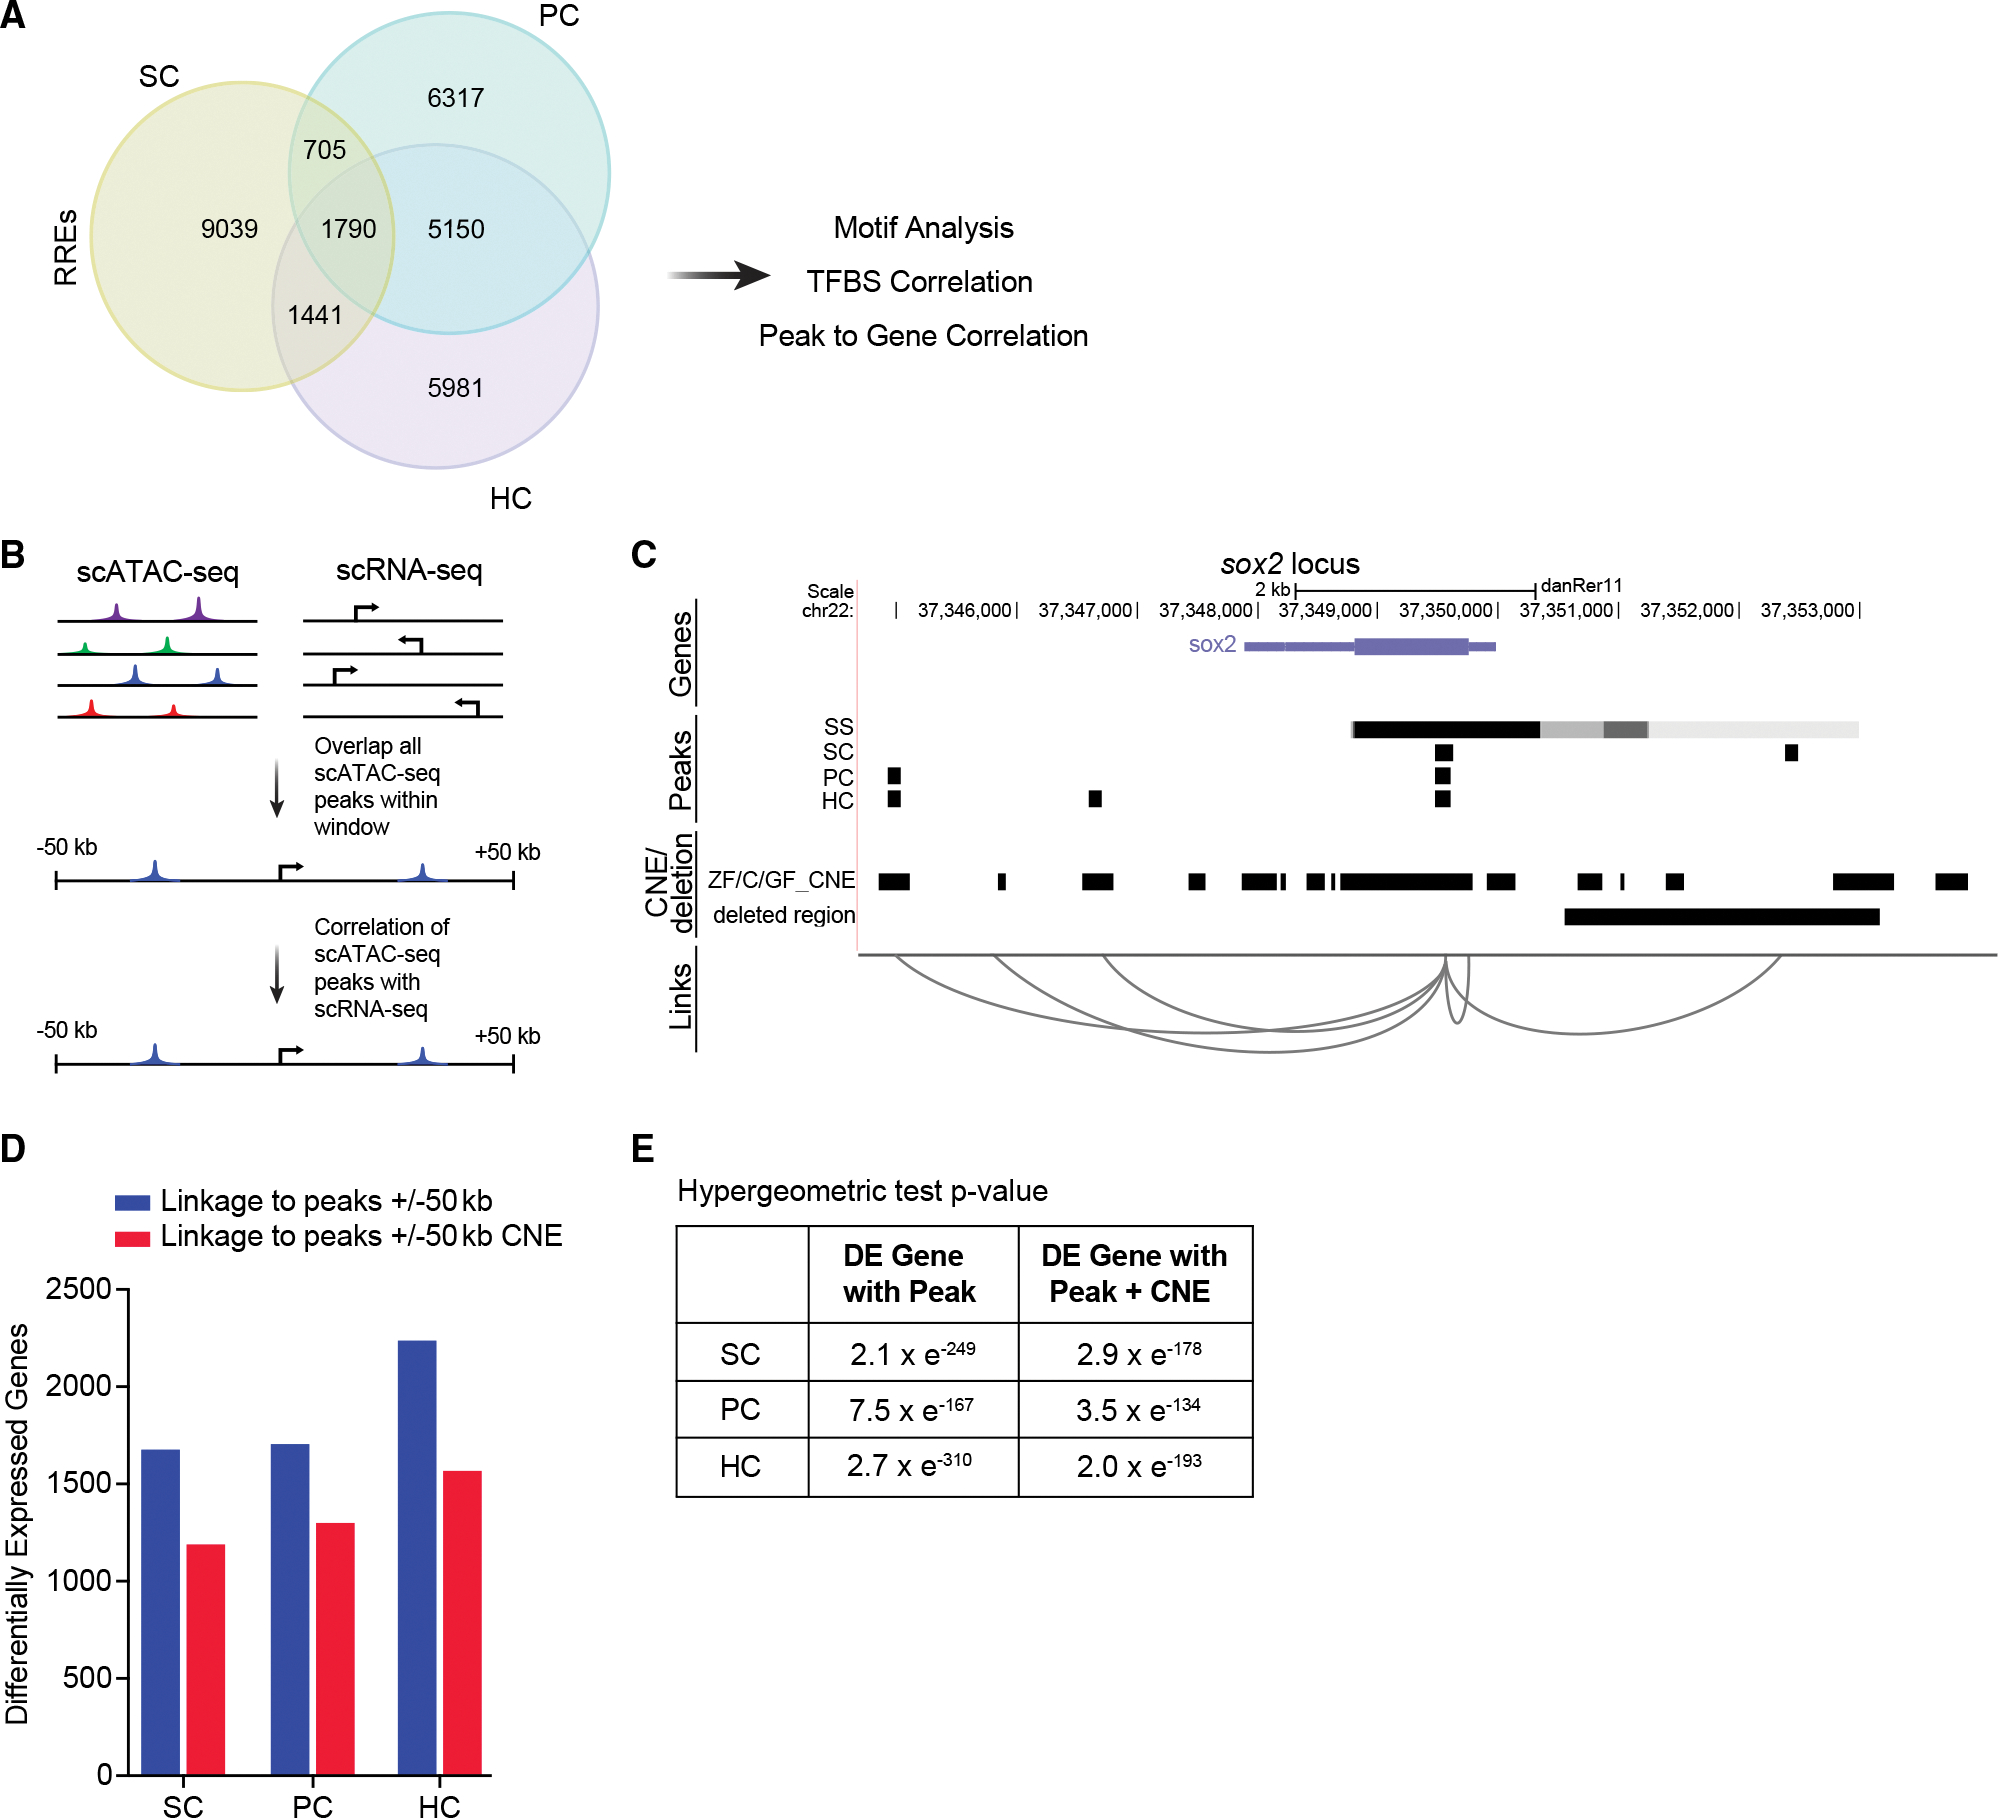
Figure 5.
Correlation of scATAC-seq peaks to conserved regions and to differentially expressed genes
(A) Venn diagram of regeneration-responsive elements (RREs) identified in SCs, PCs, and HCs.
(B) Schematic of the approach used to link scATAC-seq peaks in proximal and distal DNA elements to genes.
(C) Schematic of predicted links between peaks near the gene, sox2. For each cell type, a track is shown, including peaks present in non-regenerating controls (SS, steady state), conserved non-coding elements (CNEs) from genomic four-way phastcons (Z, zebrafish; C, grass and common carp; GF, goldfish), and the deleted region in sox2hg138 mutants. Genome coordinates of peaks, CNEs, and deleted region are represented by black bars.
(D) Bar graphs showing the number of RREs that are within 50 kb of differentially expressed genes (blue) and overlap with CNEs (red) in each cell type.
(E) Intersections of differentially expressed (DE) genes with peaks and peaks with CNEs are statistically significant (p < 0.001).