
|
Fig. 1
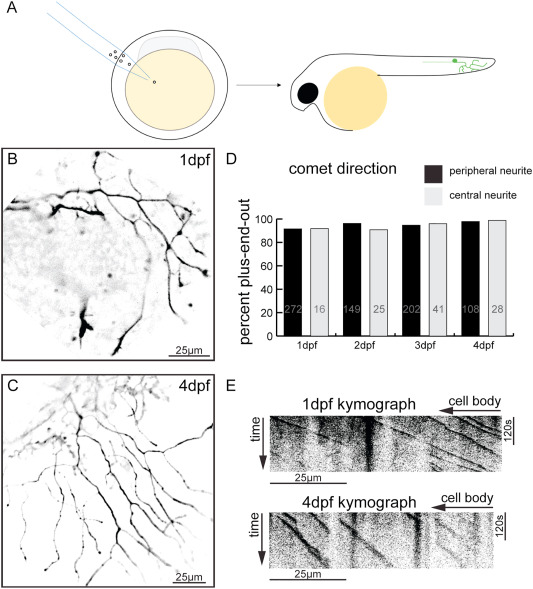
Fig. 1. Zebrafish RB neurons have uniform plus-end-out microtubule polarity. A. Schematic illustration of zebrafish egg injection. B. Maximum projection of a time-series image of a 1dpf zebrafish RB neuron expressing EB3-GFP controlled by Isl1[ss]. C. Maximum projection of a time-series image of a 4dpf zebrafish RB neuron expressing EB3-GFP D. Graph displaying quantification of comet direction in the central and peripheral neurites of RB neurons at timepoints from 1dpf to 4dpf; number on column is the number of comets counted for that condition. E. Sample kymographs of RB neurons expressing EB3-GFP at 1 and 4dpf.
Reprinted from Developmental Biology, 478, Shorey, M., Rao, K., Stone, M.C., Mattie, F.J., Sagasti, A., Rolls, M.M., Microtubule organization of vertebrate sensory neurons in vivo, 1-12, Copyright (2021) with permission from Elsevier. Full text @ Dev. Biol.