
Image
|
Figure Caption
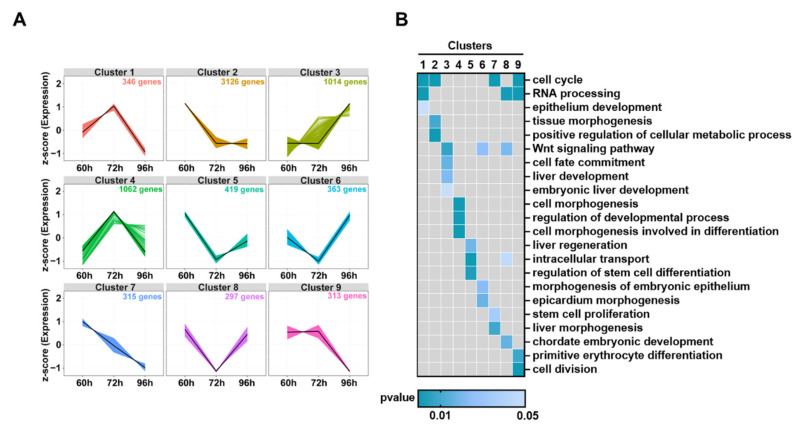
Fig. 7
Dynamic changes of DEGs in hepatocytes from 60 to 96 hpf (A) Hierarchical clustering of changes in DEGs. (B) Functional annotations of different clusters by GO analysis. Heatmaps of biological processes were displayed according to their statistical significance (p < 0.05) and locations in the GO tree.
Acknowledgments
This image is the copyrighted work of the attributed author or publisher, and
ZFIN has permission only to display this image to its users.
Additional permissions should be obtained from the applicable author or publisher of the image.
Full text @ Biomedicines