
Image
|
Figure Caption
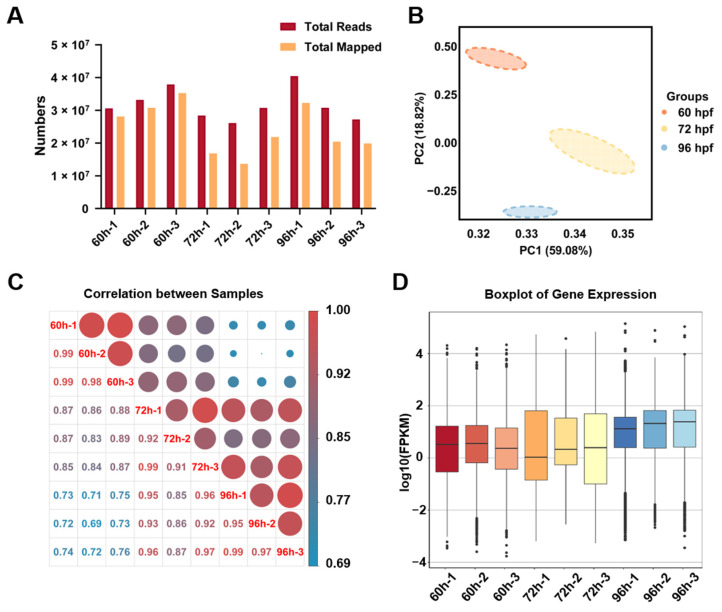
Fig. 2
The quality analysis of transcriptome data for zebrafish hepatocytes. (A) The RNA-seq data of sorted liver cells at three time points. (B) The principal component analysis (PCA) of samples at three time points. (C) The Pearson’s correlation coefficient matrix of RNA-seq between samples at three time points. (D) The boxplots of gene expression in samples at three time points.
Acknowledgments
This image is the copyrighted work of the attributed author or publisher, and
ZFIN has permission only to display this image to its users.
Additional permissions should be obtained from the applicable author or publisher of the image.
Full text @ Biomedicines