
Image
|
Figure Caption
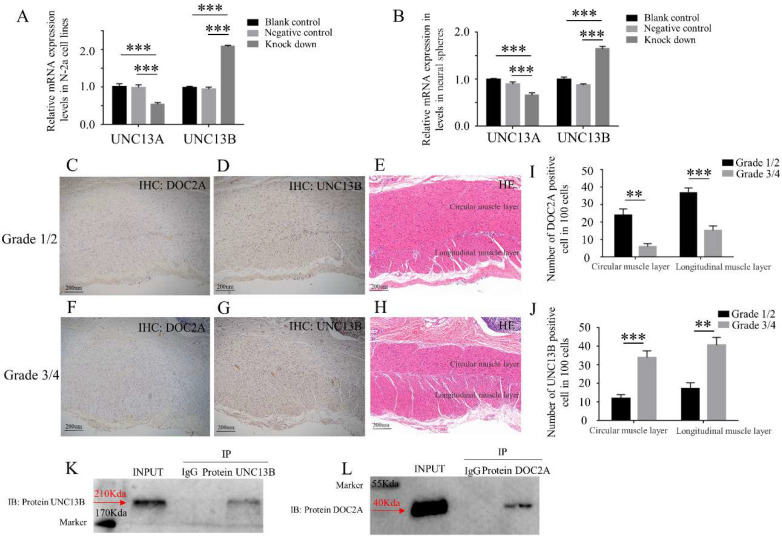
Fig. 7
Expression relationship between DOC2A and UNC13B. (A,B) Change in UNC13B after DOC2A being knocked down in N-2a cell lines and neural spheres. (C–J) Expression levels (IHC) of DOC2A and UNC13B in different grades of HSCR patient colons. **, p < 0.01; ***, p < 0.001, one-way ANOVA with Bonferroni post hoc, n = 3. (K,L), protein interaction (CO-IP) between DOC2A and UNC13B. Abbreviations: UNC13B, unc-13 homolog B; IHC, immunohistochemistry; HE, hematoxylin-eosin staining.
Acknowledgments
This image is the copyrighted work of the attributed author or publisher, and
ZFIN has permission only to display this image to its users.
Additional permissions should be obtained from the applicable author or publisher of the image.
Full text @ Int. J. Mol. Sci.