
Image
|
Figure Caption
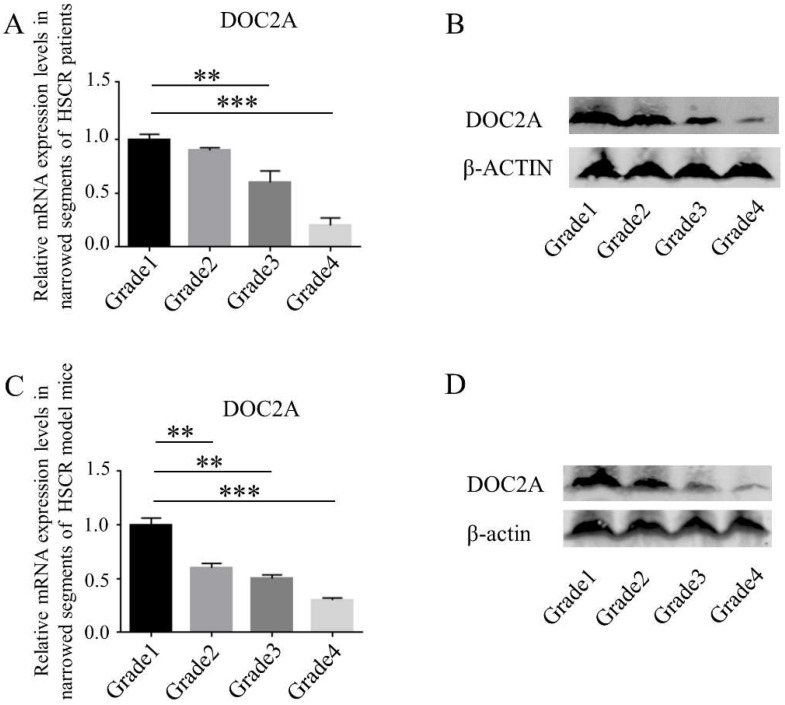
Fig. 3
Relative expression levels of DOC2A in different grades. (A,C) Quantification of mRNA expression levels of DOC2A in different grades determined by RT-qPCR. (B,D) Protein expression of the DOC2A in different grades determined by western blots. **, p < 0.01; ***, p < 0.001, one-way ANOVA with Bonferroni post hoc, n = 3. Abbreviations: DOC2A, Double C2 domain alpha; RT-qPCR, real-time quantitative PCR.
Acknowledgments
This image is the copyrighted work of the attributed author or publisher, and
ZFIN has permission only to display this image to its users.
Additional permissions should be obtained from the applicable author or publisher of the image.
Full text @ Int. J. Mol. Sci.