
FIGURE 2
- ID
- ZDB-IMAGE-220924-2
- Genes
- Publication
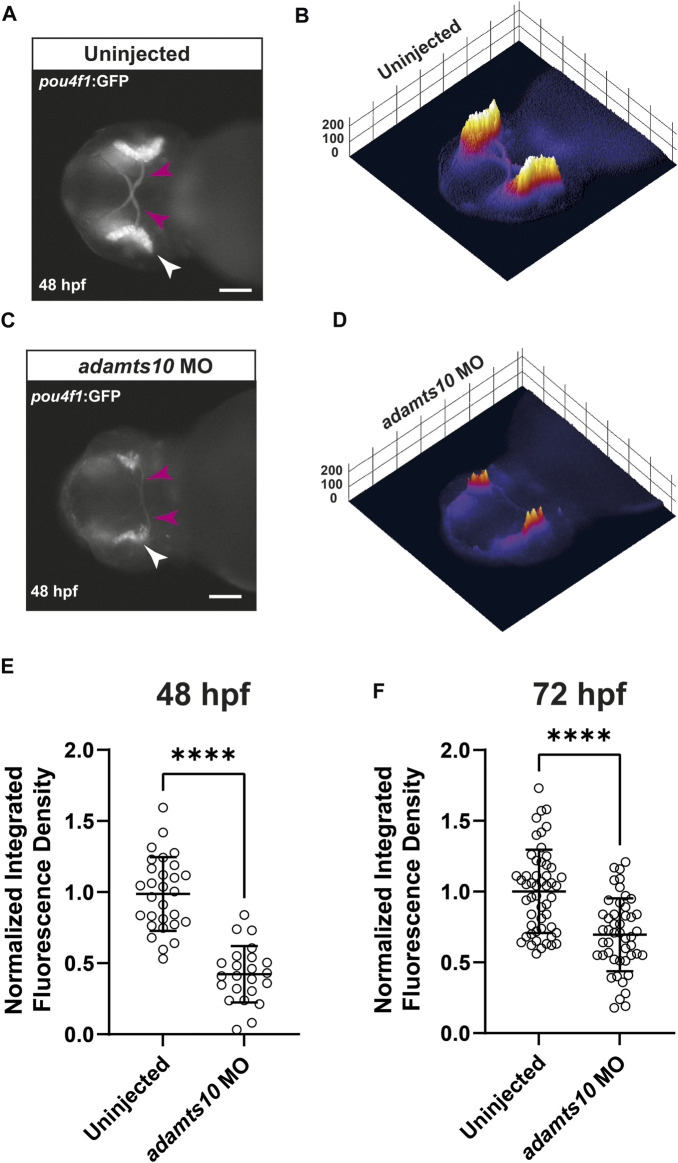
- Wareham et al., 2022 - Adamts10 controls transforming growth factor β family signaling that contributes to retinal ganglion cell development
- All Figures
- Figures for Wareham et al., 2022
|
FIGURE 2