
|
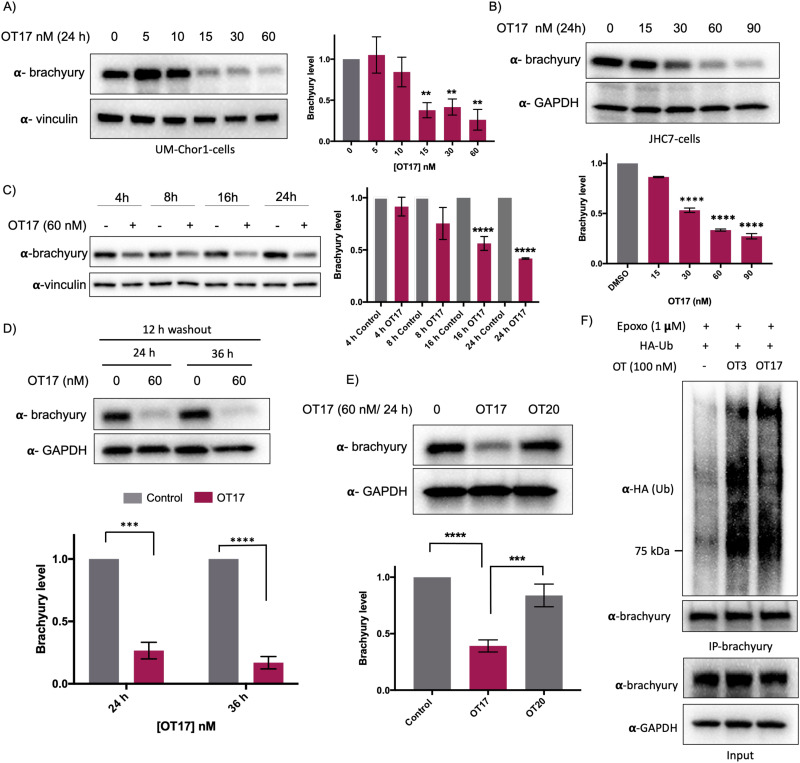
Fig. 5 Endogenous brachyury degradation by oligoTRAFTACs constructed with phosphorothioate backbone. (A) Increasing concentrations of OT17 were transfected into UM-Chor1 cells and harvested after 24 h, subjected to lysis and analyzed for brachyury downregulation. Brachyury levels were normalized to loading control and presented as a bar graph. (n = 2, **p < 0.01) (B) JHC-7 cells were transfected with OT17 and probe for brachyury levels (n = 2, ****p < 0.0001). (C) UM-Chor1 cells were transfected with 60 nM of OT17 and harvested at subsequent different time points as indicated. (n = 3, ****p < 0.0001) (D) Washout experiment: transfection medium was removed after 12 h of OT17 transfection and UM-Chor1 cells were incubated for another 12 h or 24 h in fresh complete cell culture medium. (n = 2, ***p < 0.001, ****p < 0.0001) (E) OT17-mediated brachyury degradation is oligonucleotide sequence dependent. UM-Chor1 cells were transfected with OT17 and scrambled OT20, cells were lysed and analyzed as shown. (n = 2, ***p < 0.001, ****p < 0.0001) (F) OT3- and OT17-induced brachyury ubiquitination. HEK293T cells that overexpress brachyury-GFP were transfected with HA-ubiquitin, followed by the second transfection with OT3 or OT17. After 12 h, cell lysates were subjected to immunoprecipitation using brachyury antibody, and the eluates blotted for the indicated proteins. (n = 3).