
Fig. 9
- ID
- ZDB-IMAGE-220922-25
- Publication
- Nipu et al., 2022 - Glucocorticoid receptor activation reduces food intake independent of hyperglycemia in zebrafish
- All Figures
- Figures for Nipu et al., 2022
|
Fig. 9
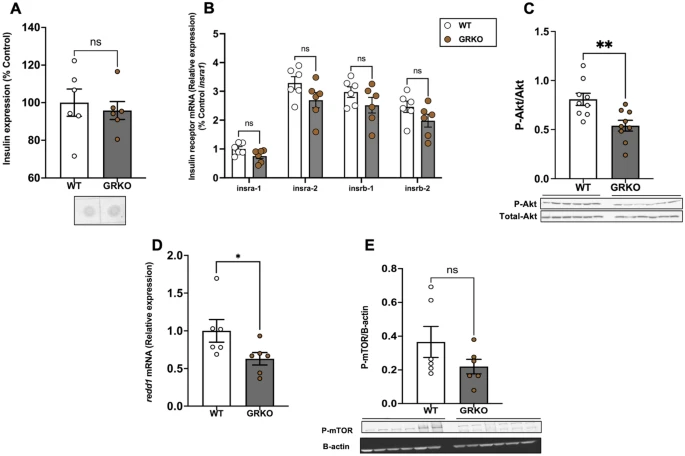
Loss of GR affects brain Akt phosphorylation. (A) Whole-body insulin levels remained unchanged in the GRKO fish compared to WT. (B) The transcript levels of the insulin receptor genes in the brain remained unchanged in GRKO fish compared to WT. (C) Loss of GR significantly decreased the ratio of phosphorylated to total Akt (M.W. 60 kDa) in the brain. (D) redd1 mRNA levels significantly decreased in the brain of GRKO fish compared to WT. E. The phosphorylation of mTOR (M.W. 289 kDa) remained unchanged when compared to the WT. Values are means ± SEM (Whole-body insulin n = 6; Protein expression n = 6–9; Transcript abundance n = 6). ns—not significant; *(P < 0.05); **(P < 0.01).