
Fig. 6
- ID
- ZDB-IMAGE-220922-22
- Publication
- Nipu et al., 2022 - Glucocorticoid receptor activation reduces food intake independent of hyperglycemia in zebrafish
- All Figures
- Figures for Nipu et al., 2022
|
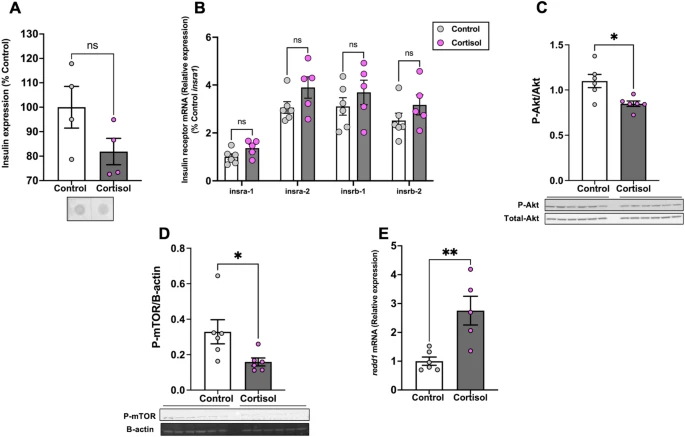
Fig. 6
Cortisol affects brain Akt and mTOR phosphorylation. (A) Cortisol treatment did not change whole-body insulin expression levels. (B) We observed no changes in the transcript levels of the insulin receptor genes in the brain after cortisol treatment. (C) The ratio of phosphorylated to total Akt (M.W.:60 kDa) in the brain was significantly lower in the cortisol-treated fish when compared to the control. (D) The phosphorylation of mTOR (M.W.:289 kDa) was also significantly lower after cortisol treatment. E. redd1mRNA levels significantly increased in the brain of the cortisol treated group compared to the control. Values are means ± SEM (Whole-body insulin n = 4; Protein expression n = 6; Transcript abundance n = 5–6). ns—not significant; *(P < 0.05); **(P < 0.01).