
IMAGE
Fig. 4
- ID
- ZDB-IMAGE-220922-20
- Publication
- Nipu et al., 2022 - Glucocorticoid receptor activation reduces food intake independent of hyperglycemia in zebrafish
- All Figures
- Figures for Nipu et al., 2022
Image
|
Figure Caption
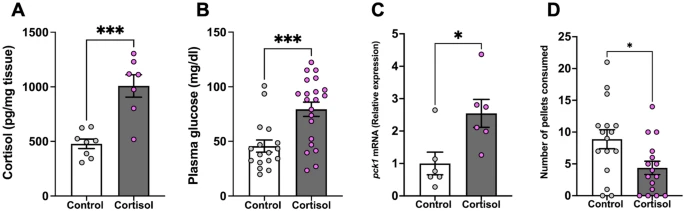
Fig. 4
Cortisol suppresses feeding. (A) Whole-body cortisol levels were higher in the cortisol-treated fish compared to the control. (B) Cortisol treatment significantly increased plasma glucose levels. (C) The pck1 transcript abundance in the liver significantly increased after cortisol treatment compared to the control. (D) Cortisol-treated fish consumed significantly fewer pellets than the control. Values are means ± SEM (Whole-body cortisol n = 7–8; Plasma glucose n = 17–21; Transcript abundance n = 6; Feeding performance n = 16). ns—not significant; *(P < 0.05); ***(P < 0.001).
Acknowledgments
This image is the copyrighted work of the attributed author or publisher, and
ZFIN has permission only to display this image to its users.
Additional permissions should be obtained from the applicable author or publisher of the image.
Full text @ Sci. Rep.