
Fig. 3
- ID
- ZDB-IMAGE-220922-19
- Publication
- Nipu et al., 2022 - Glucocorticoid receptor activation reduces food intake independent of hyperglycemia in zebrafish
- All Figures
- Figures for Nipu et al., 2022
|
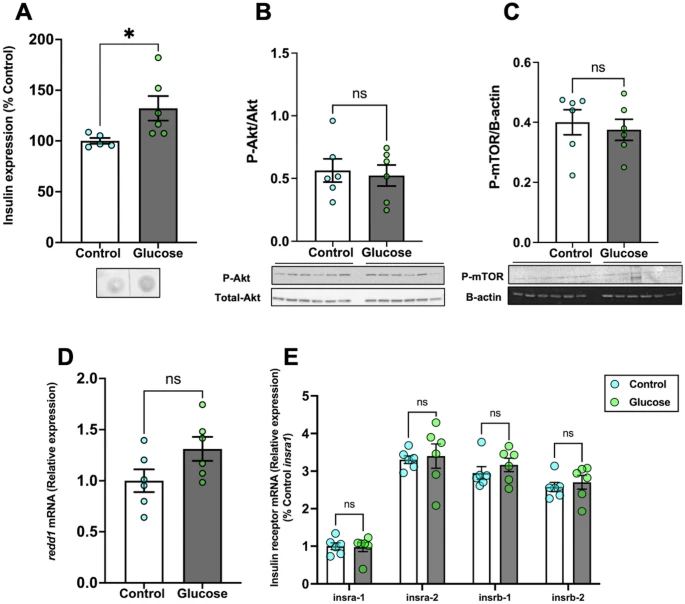
Fig. 3
Glucose did not affect Akt and mTOR phosphorylation. (A) Whole-body insulin expression significantly increased after glucose exposure compared to the control. (B) Glucose exposure did not alter the ratio of phosphorylated to total Akt (M.W.:60 kDa) in the brain when compared to the control. (C) The phosphorylation of mTOR (M.W.:289 kDa) also remained unchanged in the glucose-treated fish compared to the control. (D) Brain redd1 mRNA levels remained unchanged in the glucose-treated fish compared to the control. (E) The transcript levels of the insulin receptor genes in the brain did not change after glucose treatment. Values are means ± SEM. (Whole-body insulin n = 5–6; Protein expression n = 6; Transcript abundance n = 6). ns—not significant; *(P < 0.05).