
|
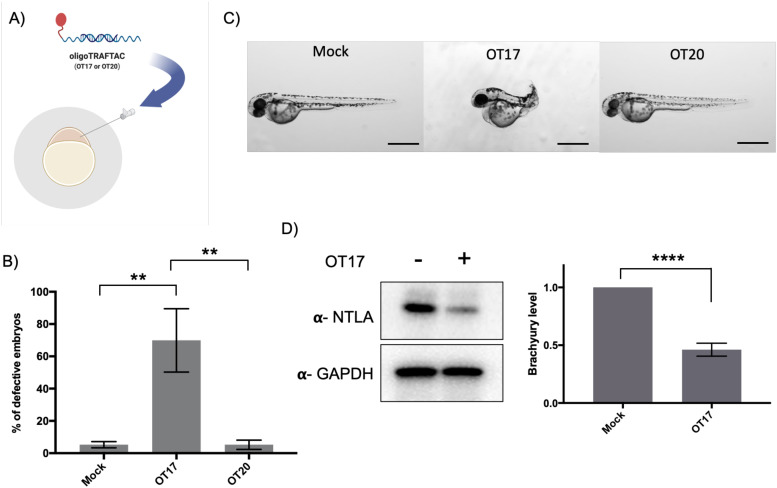
Fig. 6 Microinjection of brachyury-targeting oligoTRAFTAC into zebrafish embryos: demonstration of in vivo activity. (A) Schematic representation of OT17 and OT20 microinjection into zebrafish embryos. (B) Quantitation of the defective embryos in mock, OT17 and OT20 injected groups. Mock, OT17 and OT20 (180 picoliters from 25 μM of oligoTRAFTACs, or mock equivalent) were microinjected into embryos (number of embryos in each group for three independent experiments; mock-47, 50, 43; OT17-49, 52, 61; OT20-75, 74, 45). After 48 h, the number of defective tails in each group was recorded and presented as percentage in a bar graph. (n = 3, **p < 0.001) (C) Images of representative zebrafish from the cognate treatment groups. Pictures were captured after 48 h post microinjection of mock, OT17 and OT20. Scale bar 500 μm. (n = 3) (D) Brachyury levels in zebrafish embryos after OT17 (180 picoliters from 25 μM of oligoTRAFTACs, or mock equivalent) injection. Embryos were collected at 8–10 somite stage, subjected to lysis, and probed for brachyury levels. (n = 3, ****P < 0.0001).