
Fig. 3
- ID
- ZDB-IMAGE-220921-88
- Publication
- Chaytow et al., 2022 - Targeting phosphoglycerate kinase 1 with terazosin improves motor neuron phenotypes in multiple models of amyotrophic lateral sclerosis
- All Figures
- Figures for Chaytow et al., 2022
|
Fig. 3
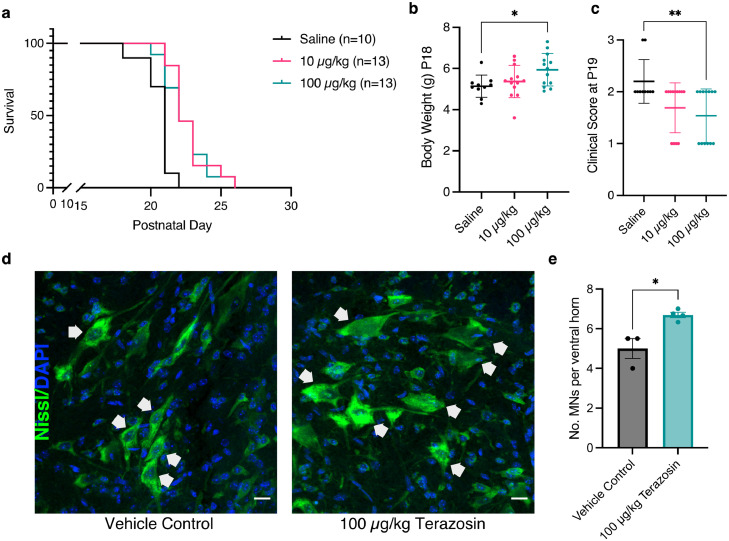
Treating hTDP-43 mice with terazosin significantly improves survival and clinical phenotypes. (a) Survival analysis for hTDP-43 mice shows a significant increase in survival when treated with 10 µg/kg (P = 0.0002; Log-rank Mantel-Cox test) or 100 µg/kg terazosin (P = 0.0023; Log-rank Mantel-Cox test) compared to vehicle controls. (b) Mice treated with 100 µg/kg terazosin show a significant increase in body weight compared to saline controls (n = 10-13 per group; One-way ANOVA P = 0.033 with Dunnett's multiple comparison test: Saline vs 10 µg/kg P = 0.67, Saline vs 100 µg/kg P = 0.025). (c) Clinical scores per treatment group at P19. Mice treated with 100 µg/kg terazosin show a significantly lower clinical score at P19 compared to saline controls (n = 10-13 per group; Kruskal-Wallis test P = 0.014 with Dunn's multiple comparison test: Saline vs 10 µg/kg P = 0.065, Saline vs 100 µg/kg P = 0.009). (d) Representative micrographs of lumbar spinal cord sections from hTDP-43 mice treated with saline vehicle control or 100 µg/kg terazosin. Motor neurons were defined as cells in the ventral horn with the shortest diameter >20 µm, represented by white arrows. Scale bar=20 µm. (e) Quantification of number of motor neurons shows a significant increase in motor neuron number following terazosin treatment (t-test P = 0.0132; n = 3-4 mice per treatment group, each point = average of 4-6 ventral horns) Error bars represent s.e.m., * = P < 0.05, ** = P < 0.01. Each point represents one mouse.