Fig. 3
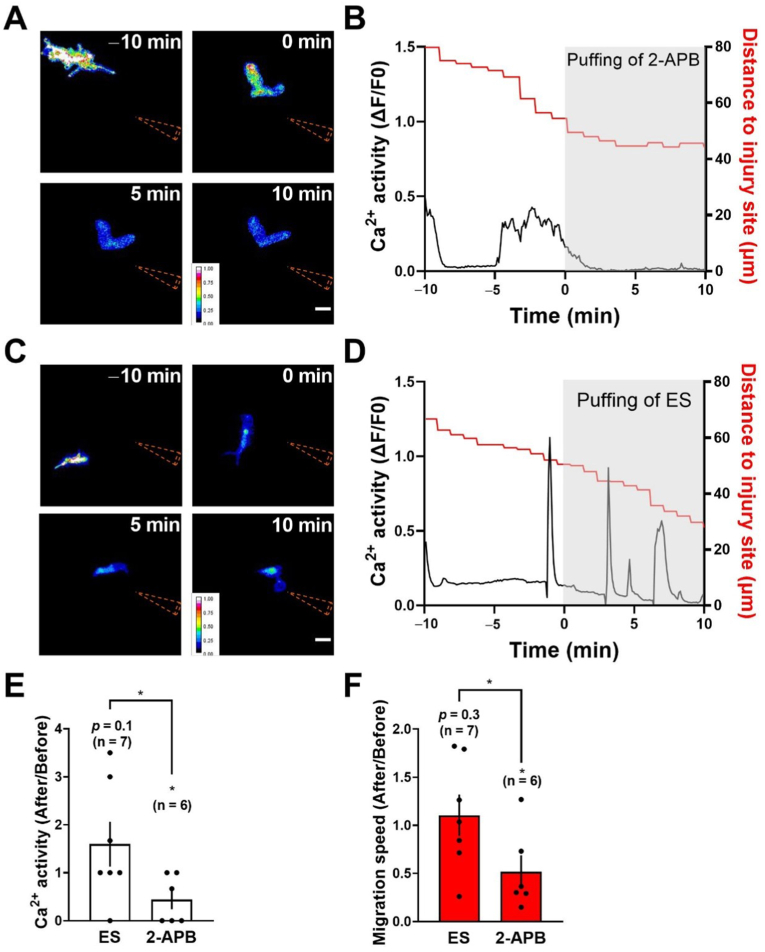
Requirement of Ca2+ activity for injury-induced migration of activated microglia.
*p < 0.05 (paired Student's t-test for comparison within each group before and after the puff, unpaired Student's t-test for comparison between groups of 2-APB and ES). Error bars, SEM.
(A) In vivo time-lapse two-photon images showing Ca2+ activity (in heatmaps) and migration of microglia evoked by micropipette-induced local brain injury (dashed orange lines) applied at time −10 min before the local puff of 2-APB (just after the time of 0 min). Scale bar, 10 μm
(B) Traces of both the Ca2+ activity (black) of the microglial cell and the distance (red) between the microglial cell body and micropipette tip for the case in (A). Gray area, application of 2-APB.
(C and D) Control case with puff of extracellular solution (ES) instead of 2-APB. Scale bar in (C), 10 μm
(E and F) Summary of changes in the Ca2+ activity (E) and migration speed (F) induced by puffing of ES or 2-APB. Each dot on the bar represents the data from an individual microglial cell examined. . (For interpretation of the references to colour in this figure legend, the reader is referred to the Web version of this article.)

