
|
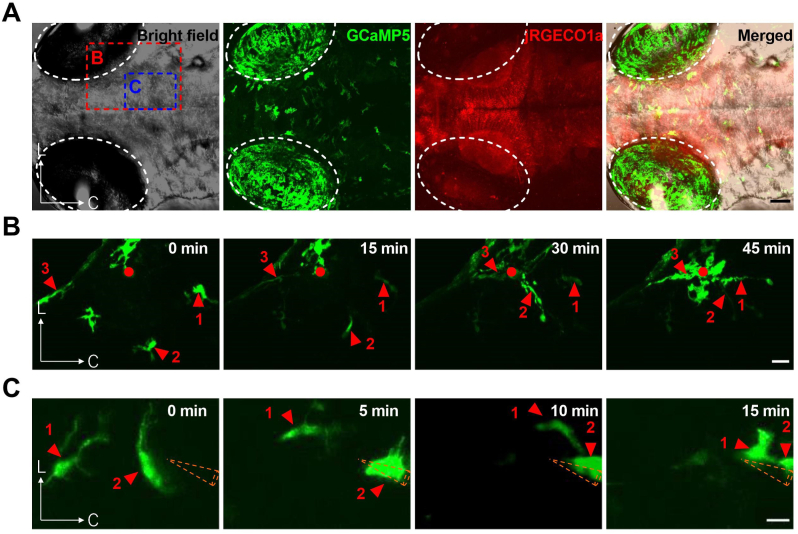
Fig. 1
Local brain injury-induced migration of microglia in larval zebrafish in vivo.
(A) Whole-brain projection images showing the distribution of microglia (GCaMP5-positive, green) and neurons (jRGECO1a-positive, red) in a double transgenic larva Tg(coro1a:GCaMP5);Tg(HuC:NES-jRGECO1a) at 5 dpf. The green signals on the eyeballs were auto-fluorescence. C, caudal; L, lateral. Scale bar, 50 μm
(B) In vivo time-lapse (with a 5-s interval) two-photon images showing microglia's directional migration evoked by two-photon laser-induced local brain injury (red dot). Only time series at a 15-min interval were shown. The time point of 0 min indicates the onset of injury induction. The numbers and arrowheads indicate the microglia traced across the whole imaging. The image field is outlined in (A), and the images were obtained from a 7-dpf larva. Scale bar, 20 μm
(C) In vivo time-lapse (with a 4-s interval) two-photon images showing microglia's directional migration evoked by micropipette (dashed orange lines)-induced local brain injury. Only time series at a 5-min interval were shown. The time point of 0 min indicates the onset of micropipette insertion. The numbers and arrowheads indicate the microglia traced across the whole imaging. The image field is outlined in (A), and the images were obtained from a 5-dpf larva. Scale bar, 10 μm. . (For interpretation of the references to colour in this figure legend, the reader is referred to the Web version of this article.)