IMAGE

Fig. 4

ID
ZDB-IMAGE-220921-135
Source
Figures for Andreassen et al., 2022
Image
Figure Caption

Fig. 4

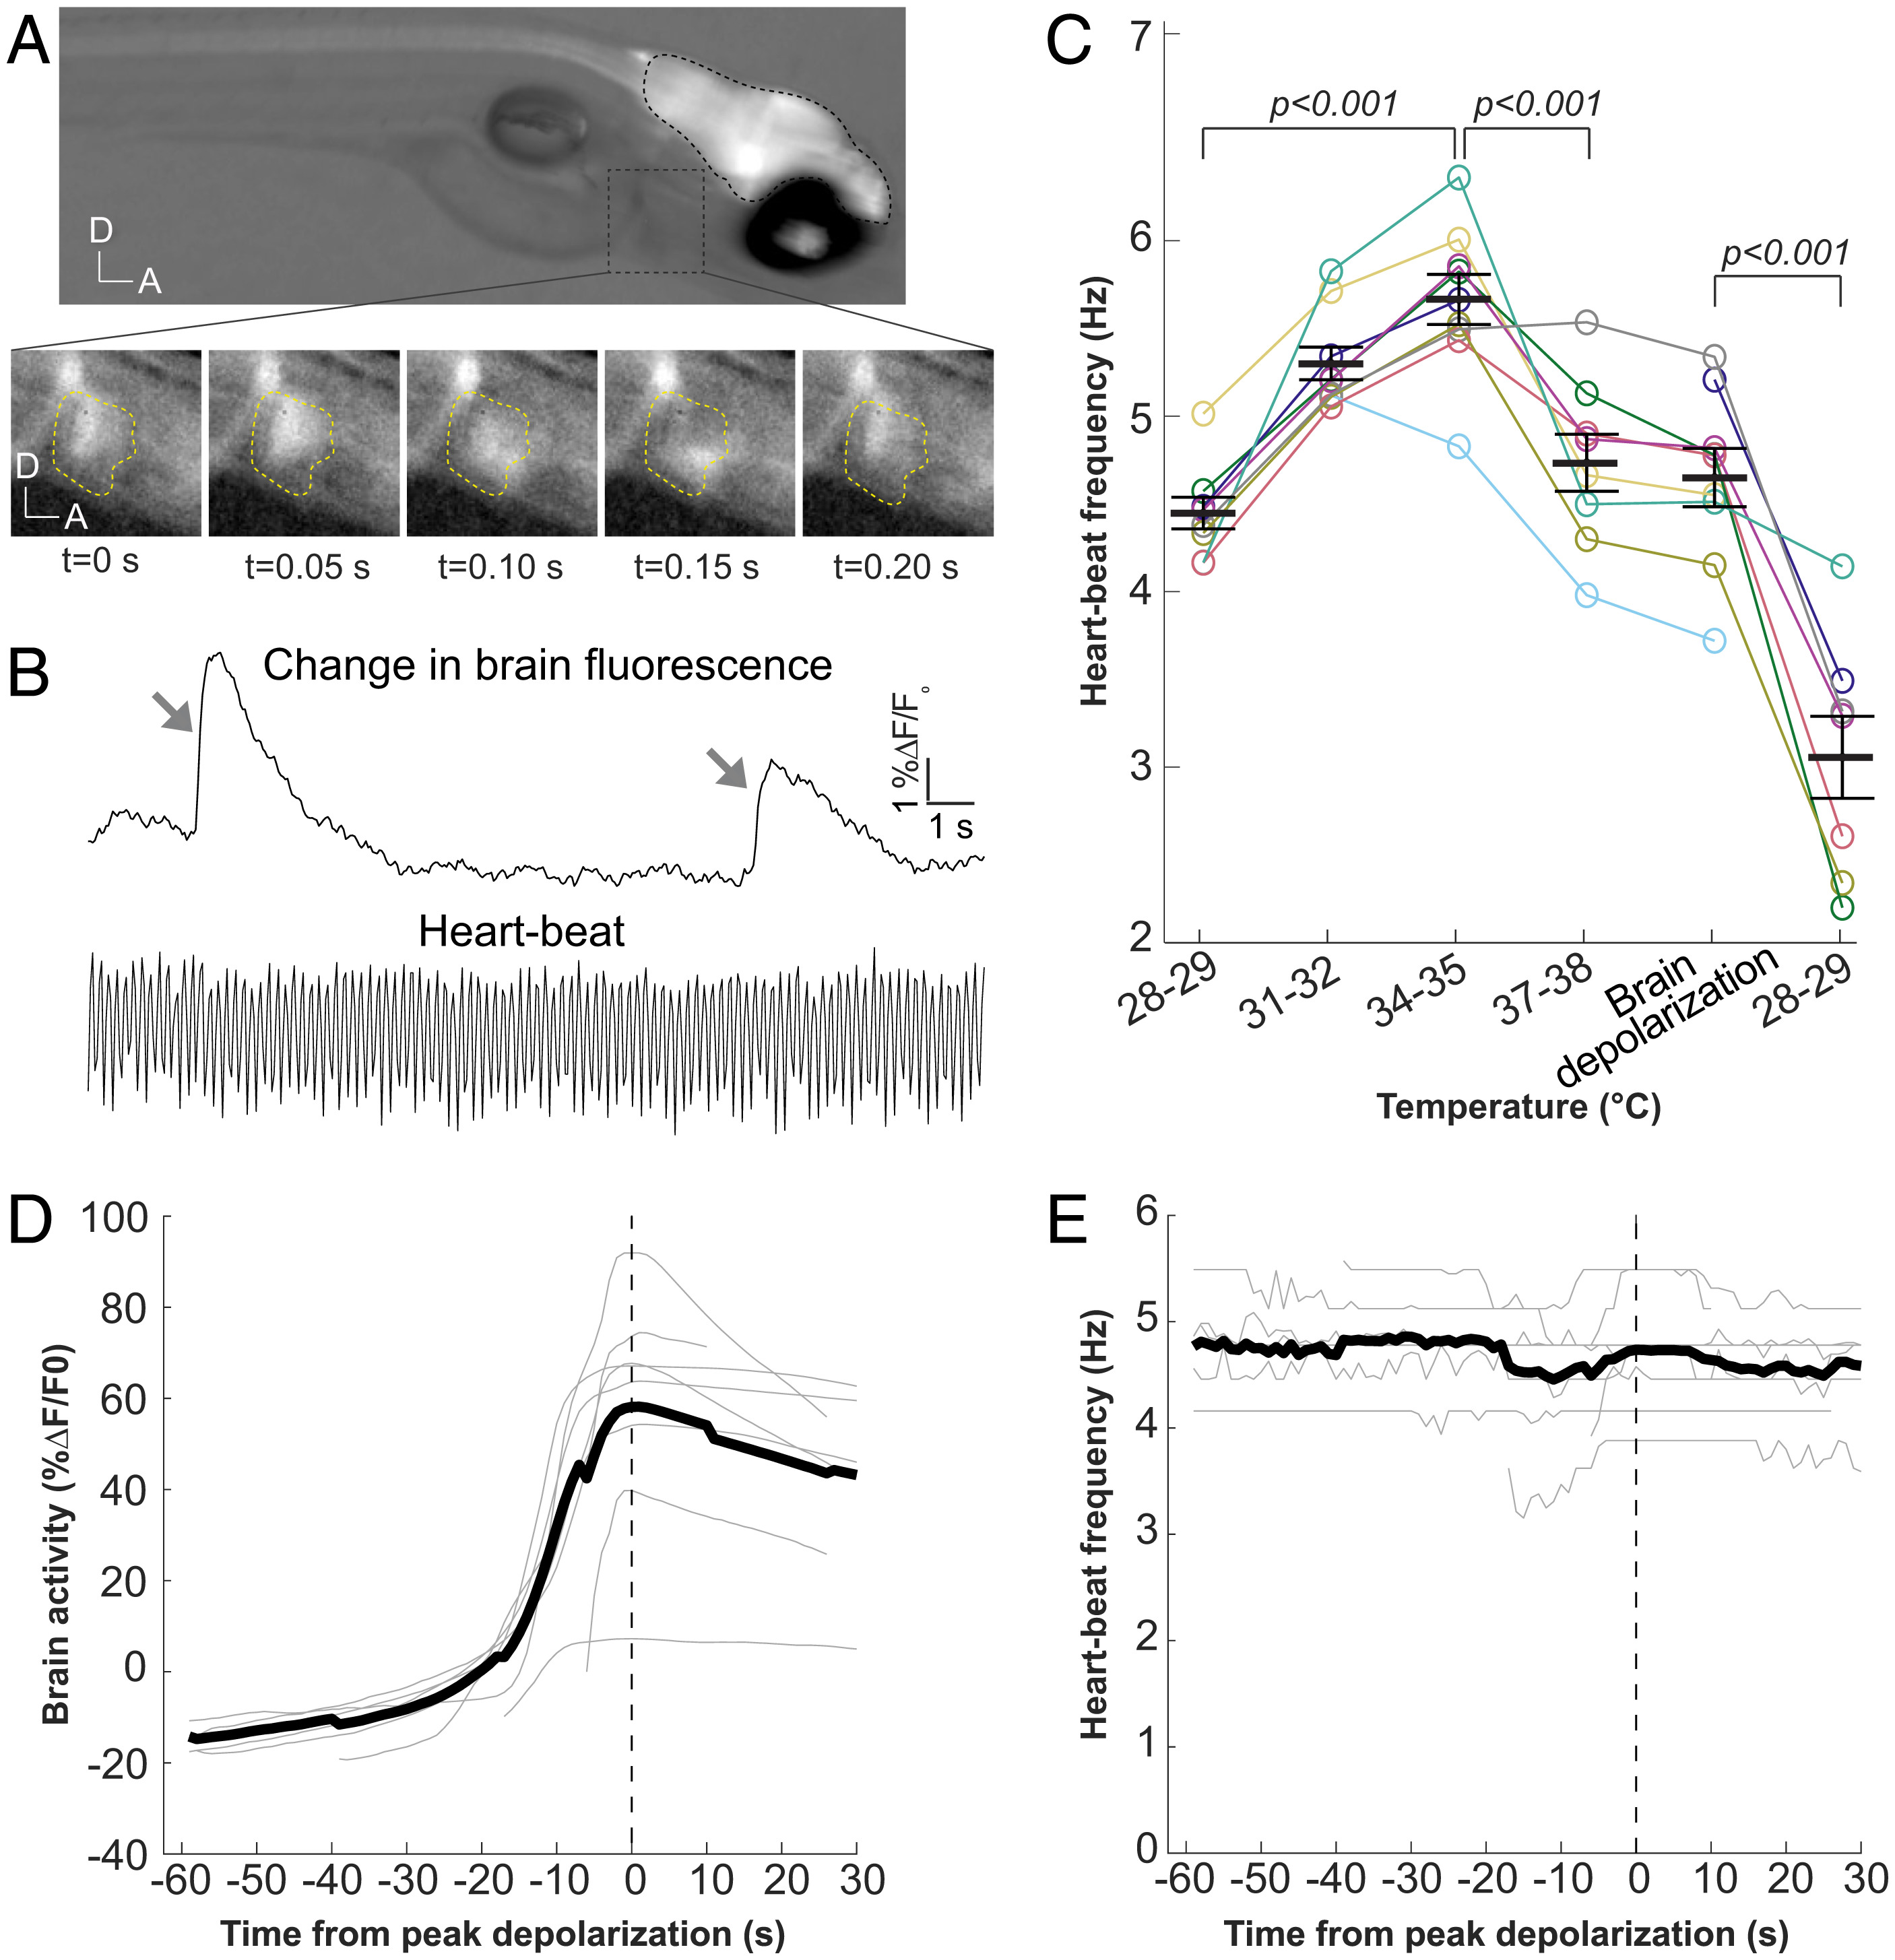
Heart rate before and during the brain-wide depolarization in embedded zebrafish larvae. (A, Top) Representative example of simultaneous neural-activity and heart-rate imaging in a 5-d-old Tg(elavl3:GCaMP6s) zebrafish larva embedded laterally in agar, using epifluorescence microscopy. The brain is outlined with black dashed lines and the heart with a dashed gray square. (Bottom) The heart region (dashed yellow line) is shown in inverted greyscale (A, anterior; D, dorsal) during a cardiac cycle. (B; Top) Change in brain fluorescence (%?F/F0) in the same fish as in A, at 31 °C. Changes in brain fluorescence are indicated by gray arrows. (Bottom) Change in luminosity within a region of interest in the heart during the same period, which is used to calculate the heart rate. (C) Average heart rate in embedded heat-ramp fish (n = 9). The x-axis shows ranges of 1 °C elevation during which the heart rate was measured. The fifth temperature category (brain depolarization) corresponds to heart rate during the 60 s before and the 30 s after peak brain depolarization. The sixth category corresponds to heart rate after fish were rapidly returned to holding temperature. Horizontal bars and error bars indicate the mean and SE. The colored lines represent individual fish (SI Appendix, Table S6). (D and E) Change in neural activity (D) and heart rate (E) during the brain-wide depolarization (same period as brain depolarization in C). Gray lines represent individual fish and the thick black line represents the mean. All traces are aligned with respect to the peak fluorescence (vertical dashed line).

Acknowledgments
This image is the copyrighted work of the attributed author or publisher, and ZFIN has permission only to display this image to its users. Additional permissions should be obtained from the applicable author or publisher of the image. Full text @ Proc. Natl. Acad. Sci. USA