
Fig. 1
- ID
- ZDB-IMAGE-220920-66
- Publication
- Tian et al., 2022 - WRN promotes bone development and growth by unwinding SHOX-G-quadruplexes via its helicase activity in Werner Syndrome
- All Figures
- Figures for Tian et al., 2022
|
Fig. 1
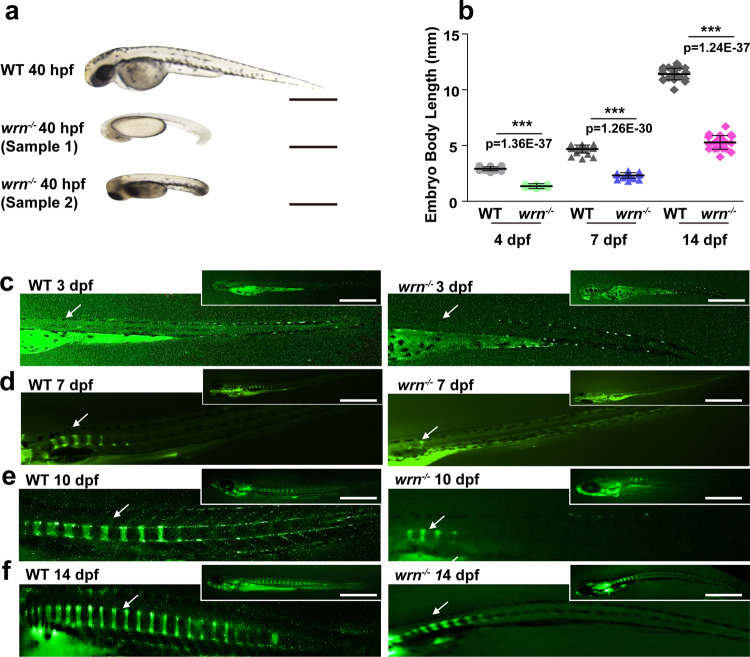
a Representative bright-field images of 3 independent experiments between WT and wrn−/− mutant zebrafish at 40 hpf. Scale bar = 100 µm. b Dot graph analysis of the total body length of WT and wrn−/− mutants from 4 dpf to 14 dpf. N = 25 independent embryos for WT and wrn−/− mutants, respectively. Each dot represents a biological replicate. c–f Representative calcein green staining of 3 independent experiments to examine bone formation between WT and wrn−/− mutant zebrafish from 3 dpf to 14 dpf. White arrows indicate vertebrate regions. Scale bar = 100 µm. Data are presented as the mean ± S.D. Statistical analysis was performed using two-tailed unpaired Student’s t-test. *P < 0.05, **P < 0.01, ***P < 0.001.