
|
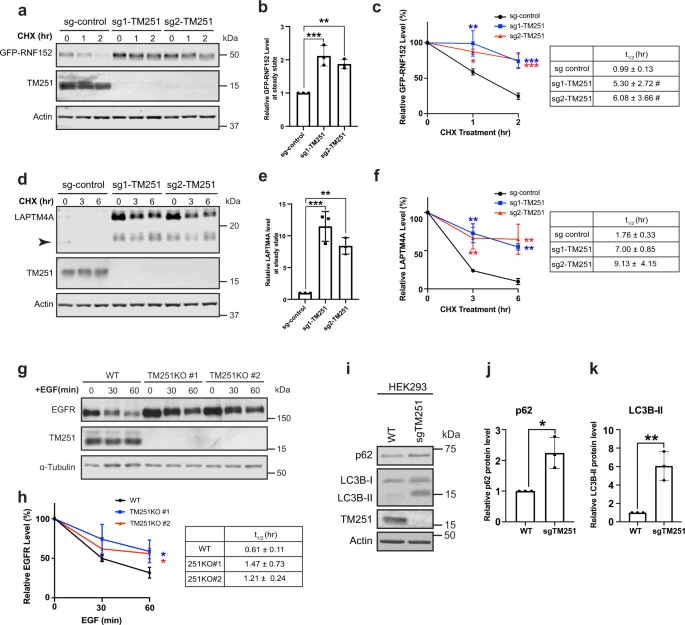
Fig. 2
a CHX chase assay of stably expressed GFP-RNF152 in sgRNA control, sgRNA-1 TMEM251, and sgRNA-2 TMEM251 cells. b Steady-state (0 h) protein levels in a. Mean of 3 independent replicates is shown. Error bars represent standard deviation. **p ≤ 0.01, ***p ≤ 0.001. c Quantification of GFP-RNF152 degradation in a. Mean of 3 independent replicates is shown. Error bars represent standard deviation. *p ≤ 0.05, **p ≤ 0.01, ***p ≤ 0.001. Table: Calculated protein half-lives. d CHX chase assay of endogenous LAPTM4A in sgRNA control, sgRNA-1 TMEM251, and sgRNA-2 TMEM251 cells. Arrowhead: cleavage product of LAPTM4A. e Steady-state (0 h) LAPTM4A protein levels in d. Mean of 3 independent replicates is shown. Error bars represent standard deviation. **p ≤ 0.01, ***p ≤ 0.001. f Quantification of LAPTM4A degradation in d, Mean of 3 independent replicates is shown. Error bars represent standard deviation. **p ≤ 0.01. Table: Calculated protein half-lives. g EGFR degradation assay in HeLa WT and TMEM251 KO cells. h Quantification of EGFR degradation in g. Mean of 3 independent replicates is shown. Error bars represent standard deviation. *p ≤ 0.05. Table: Calculated protein half-lives. i p62 and LC3B protein levels in HEK293 WT and sgTMEM251 cells. j, k Quantification of the p62 (j) and LC3B-II (k) protein levels in (i). Mean of 3 independent replicates is shown. Error bars represent standard deviation. *p ≤ 0.05. **p ≤ 0.01. See source data file for exact P values.