
|
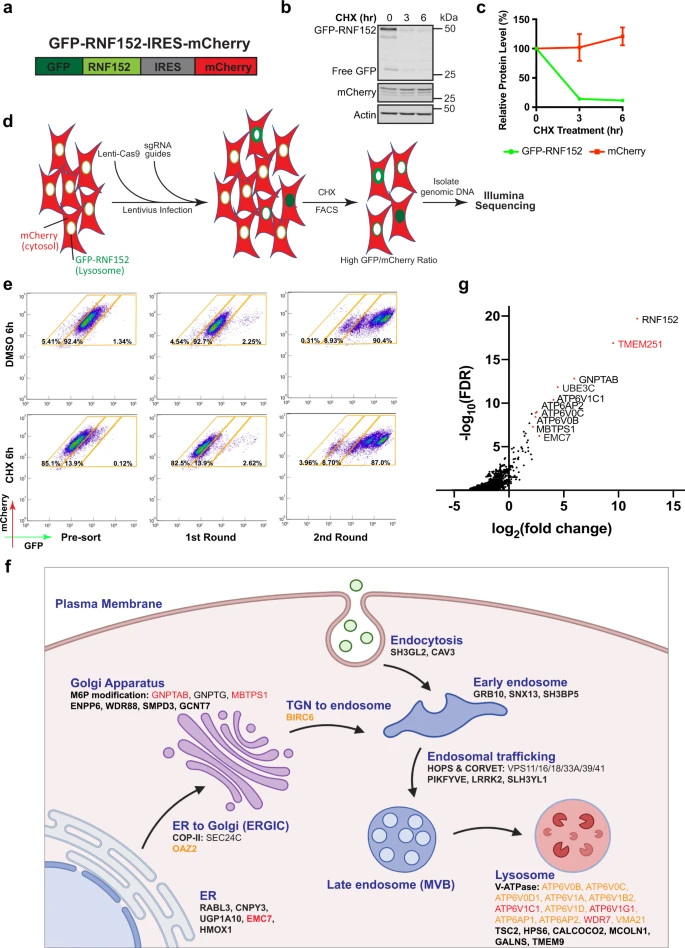
Fig. 1
a A schematic representation of the reporter construct. b CHX chase assay of stably expressed GFP-RNF152 and mCherry in HEK293 cells. c Quantification of the protein levels in b. Mean of 3 independent replicates is shown. Error bars represent standard deviation. d A schematic representation of the CRISPR-Cas9 screen to identify genes essential for lysosome function. e Flow cytometry profiles of presorted and sorted cells from the CRISPR-Cas9 screen with or without CHX treatment. f A schematic representation of hits from the CRISPR-Cas9 screen that highlights the membrane trafficking pathways (Created with BioRender.com). Black: hits from the first-round sorting. Orange: hits from the second-round sorting. Red: hits appeared in both rounds of sorting. g Top 10 hits of Illumina sequencing of sgRNAs from the second round of sorting.