
Image
|
Figure Caption
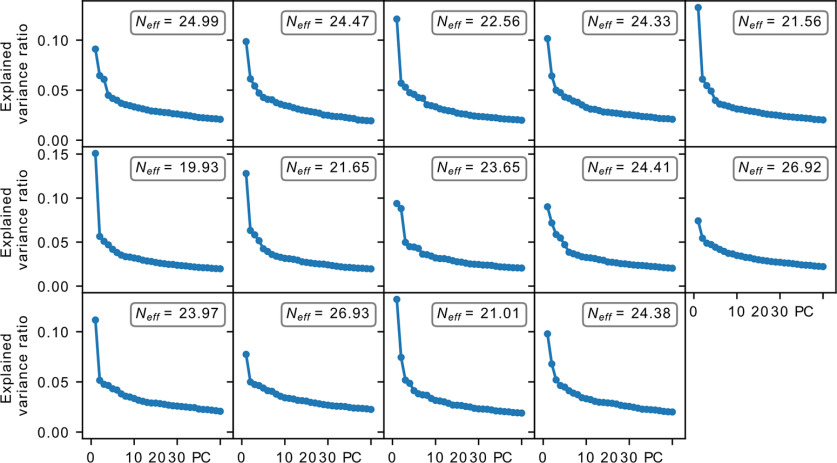
Figure 7.
PCA explained variance ratio for the accepted datasets. All cases display a gradual decline instead of just a single dominant contribution, with the effective dimensions being significantly >1. In addition, activity along the different principal components have heterogeneous loadings (Extended Data
Acknowledgments
This image is the copyrighted work of the attributed author or publisher, and
ZFIN has permission only to display this image to its users.
Additional permissions should be obtained from the applicable author or publisher of the image.
Full text @ eNeuro