IMAGE

Figure 1.

ID
ZDB-IMAGE-220912-68
Source
Figures for Suryadi et al., 2022
Image
Figure Caption

Figure 1.

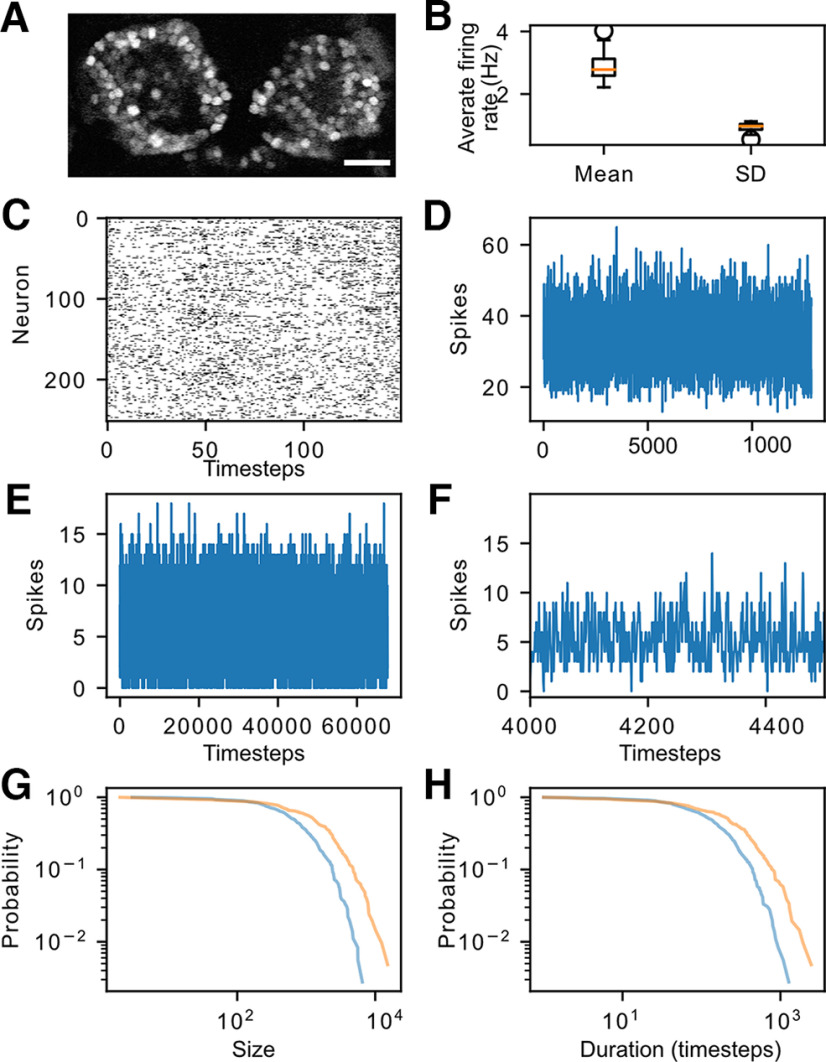
Characterization of neuronal avalanches in the habenula. A, The habenula of Tg(elavl3:H2B-GCaMP6s) fish, imaged at 15 Hz. Scale bar, 25 μm. B, Population statistics (mean and standard deviation, SD) of the neuron average firing rate aggregated over all recordings. The individual firing rate distributions for each recording are given in Extended Data Figure 1-1. C, Activity in a subset of neurons in the habenula imaged at 15 Hz. The black lines indicate frames where there is at least one spike inferred by MLspike. D, Plot showing number of spikes across the population as inferred by MLspike. E, F, Inferred spikes, obtained from imaging a single plane at 113 Hz. E is the entire recording, whereas F is a zoomed in version to a portion. G, H, Distribution of avalanche size (G) and duration (H) in fish imaged at 113 Hz at a single plane. The blue curve is based on data from one fish, while the orange curve is derived from a second fish. The log-log plots are not linear, indicating the absence of a power law. Further avalanche analyses are given in Extended Data Figure 1-2.

Acknowledgments
This image is the copyrighted work of the attributed author or publisher, and ZFIN has permission only to display this image to its users. Additional permissions should be obtained from the applicable author or publisher of the image. Full text @ eNeuro