
Fig. 4
- ID
- ZDB-IMAGE-220912-18
- Publication
- Zink et al., 2022 - Altered Expression of TMEM43 Causes Abnormal Cardiac Structure and Function in Zebrafish
- All Figures
- Figures for Zink et al., 2022
|
Fig. 4
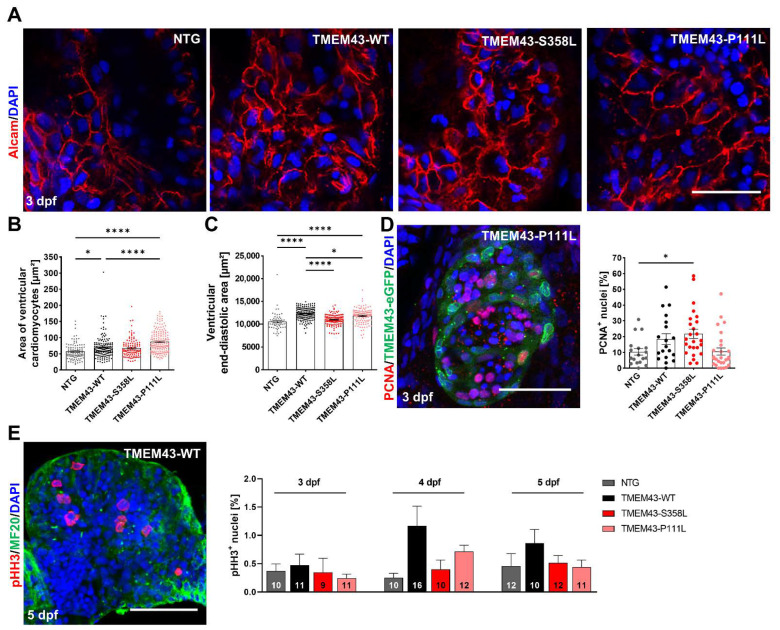
Cardiac overexpression of stably folded TMEM43 leads to hypertrophic ventricular growth, but unchanged proliferation capacity in embryos. (A) Confocal maximum intensity projections of 3 days post fertilization (dpf) hearts immunostained with DAPI (blue) and Alcam (red) to highlight plasma membranes. Scale bar = 30 µm. (B) Quantification of cardiomyocyte (CM) area represented in (A) reveals larger CMs in TMEM43-WT and TMEM43-P111L compared to non-transgenic control (NTG) and TMEM43-S358L individuals (n ≥ 10 hearts per genotype). (C) Quantification of ventricular end-diastolic area shows the mean area of three individual sections of each fish from a time series of the embryonic cardiac cycle. Significantly increased end-diastolic ventricular areas were measured in TMEM43-WT and TMEM43-P111L compared to NTG and TMEM43-S358L individuals. (D) Representative confocal maximum intensity projection of a heart immunostained with PCNA (red), GFP (green), and DAPI (blue) at 3 dpf. Scale bar = 50 µm. In the graph, individual data points represent the percentage of PCNA+ nuclei in the ventricle of each fish (n ≥ 18 individuals per genotype). A slightly increased proliferation rate was observed in the TMEM43-S358L transgenic line compared to NTG. (E) Representative maximum intensity projection of a dissected heart immunostained with pHH3 (red), MF20 (targeting MYH1E; green) and DAPI (blue) at 5 dpf. Scale bar = 50 µm. The graph displays the mean percentage of pHH3+ cell nuclei for each genotype at 3 dpf, 4 dpf, and 5 dpf. The number of analyzed hearts per condition are indicated at the bottom of the columns. (B–E) For all graphs, significance was determined by one-way ANOVA with Bonferroni’s multiple comparison test, * p ≤ 0.05, **** p ≤ 0.0001. Error bars correspond to SEM.