
Fig. 9
- ID
- ZDB-IMAGE-220912-152
- Publication
- McCarthy et al., 2022 - Prolonged Hyperglycemia Causes Visual and Cognitive Deficits in Danio rerio
- All Figures
- Figures for McCarthy et al., 2022
|
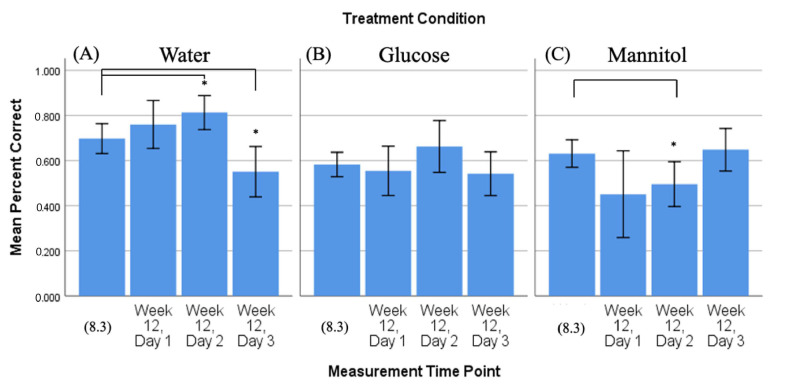
Fig. 9
Comparison of 8-week vs. 12-week washout reversal. Mean percent correct scores (+/−95% CI) calculated on 8-week reversal day 3 (8.3) were compared (individual t-tests) to scores calculated on all three 12-week reversal days for (A) water-treated, (B) glucose-treated, and (C) mannitol-treated fish. At the 12-week timepoint, the fish had been exposed to hyperglycemic conditions for 8-weeks, followed by 4 weeks of recovery. Water-treated fish showed an increase in correct scores at day 2 (p = 0.021), but a decrease on reversal day 3. The percent correct scores in glucose-treated fish were not different across all three reversal days or compared to 8.3. Mannitol-treated fish also had responses similar to 8.3, though the percentage of correct scores was reduced on reversal day 2 (p = 0.021). Asterisks denote significant differences.