
Fig. 8
- ID
- ZDB-IMAGE-220912-151
- Publication
- McCarthy et al., 2022 - Prolonged Hyperglycemia Causes Visual and Cognitive Deficits in Danio rerio
- All Figures
- Figures for McCarthy et al., 2022
|
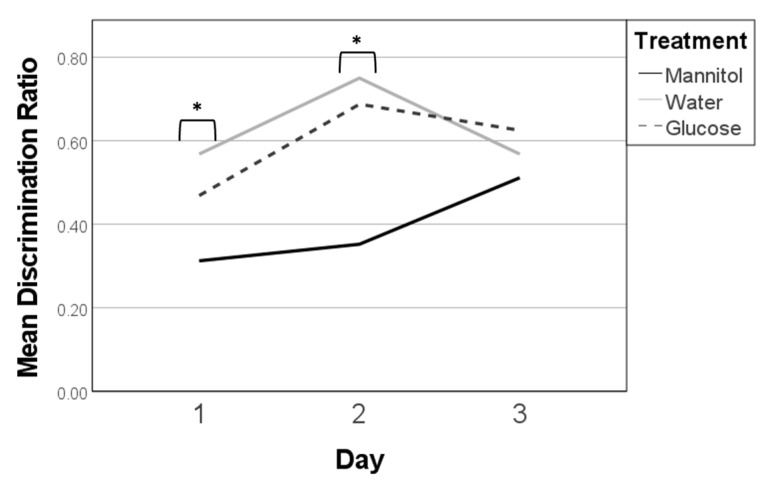
Fig. 8
Discrimination ratios in the 12-week washout experiments. Discrimination ratios were calculated on all three 12-week reversal days (day 1, day 2, day 3). In this experiment, fish were exposed to hyperglycemic conditions for 8 weeks, followed by 4 weeks in normglycemic (system water) conditions. Significant differences in discrimination ratios were observed on days 1 and 2, when the responses of mannitol treated fish were lower than responses of fish in the glucose- or water-treatment groups (one-way ANOVA, F (2,82) = 7.051, p = 0.001, *). However, subsequent trendline analysis did not identify any significant differences across reversal days.