
Fig. 7
- ID
- ZDB-IMAGE-220912-150
- Publication
- McCarthy et al., 2022 - Prolonged Hyperglycemia Causes Visual and Cognitive Deficits in Danio rerio
- All Figures
- Figures for McCarthy et al., 2022
|
Fig. 7
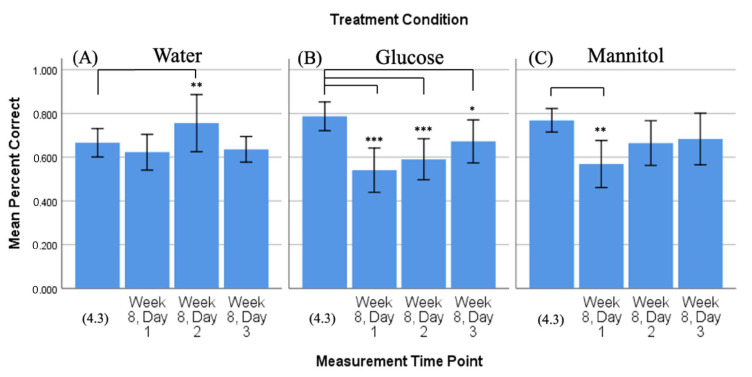
Comparison of 4-week vs. 8-week washout reversal. Mean percent correct scores (+/−95% CI) calculated on 4-week reversal day 3 (4.3) were compared to scores calculated on all three 8-week reversal days for (A) water-treated, (B) glucose-treated, and (C) mannitol-treated fish. In these experiments, 8-week fish were maintained in hyperglycemic conditions for 4 weeks, followed by a 4-week removal from treatment. Water-treated fish displayed a significant increase in percent correct scores on day 2 only (p = 0.004, panel (A), **); scores on other days were not different from 4.3. Glucose-treated fish had a significantly lower number of correct scores on all three 8-week reversal days (day 1 p < 0.001; day 2 p = 0.001; day 3 p = 0.05; individual t-tests performed on each day. *,*** Asterisks in (B) denote significant differences with the number of asterisks reflecting level of significance). Mannitol-treated fish had significantly lower correct scores on day 1 only (p = 0.002, **).