
Fig. 2
- ID
- ZDB-IMAGE-220912-145
- Publication
- McCarthy et al., 2022 - Prolonged Hyperglycemia Causes Visual and Cognitive Deficits in Danio rerio
- All Figures
- Figures for McCarthy et al., 2022
|
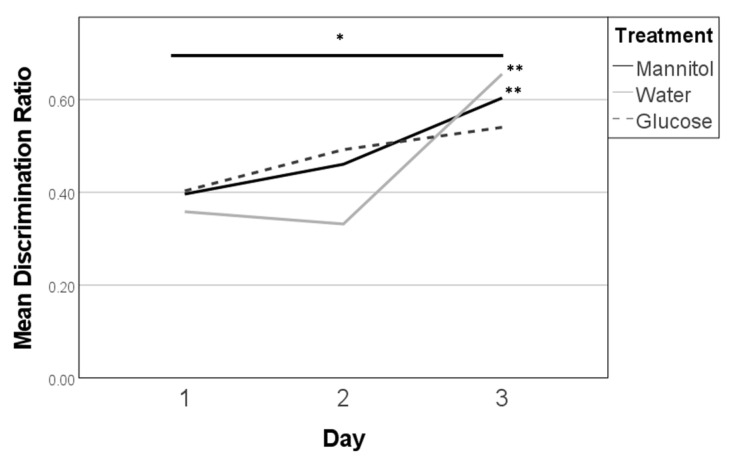
Fig. 2
Discrimination ratios after 8 weeks of prolonged hyperglycemia. Discrimination ratios were calculated on all three 8-week reversal days (day 1, day 2, day 3) for responses of fish in each treatment group and analyzed on each day using one-way ANOVA. A significant difference due to reversal day (single asterisk) was noted (F (2,278) = 13.462, p < 0.001). Subsequent trendline analysis identified significant trends in responses for mannitol and water-treated fish (double asterisk) characterized by increased scores from day 1 to day 3 (p = 0.007, and p < 0.001, respectively). Significant trend lines suggest that the fish learned the new location of the shoal reward. A significant trend line was not found for glucose-treated fish (dashed line).