
IMAGE
Fig. 1
- ID
- ZDB-IMAGE-220912-138
- Publication
- Bartoszewski et al., 2022 - A Zebrafish/Drosophila Dual System Model for Investigating Human Microcephaly
- All Figures
- Figures for Bartoszewski et al., 2022
Image
|
Figure Caption
Fig. 1
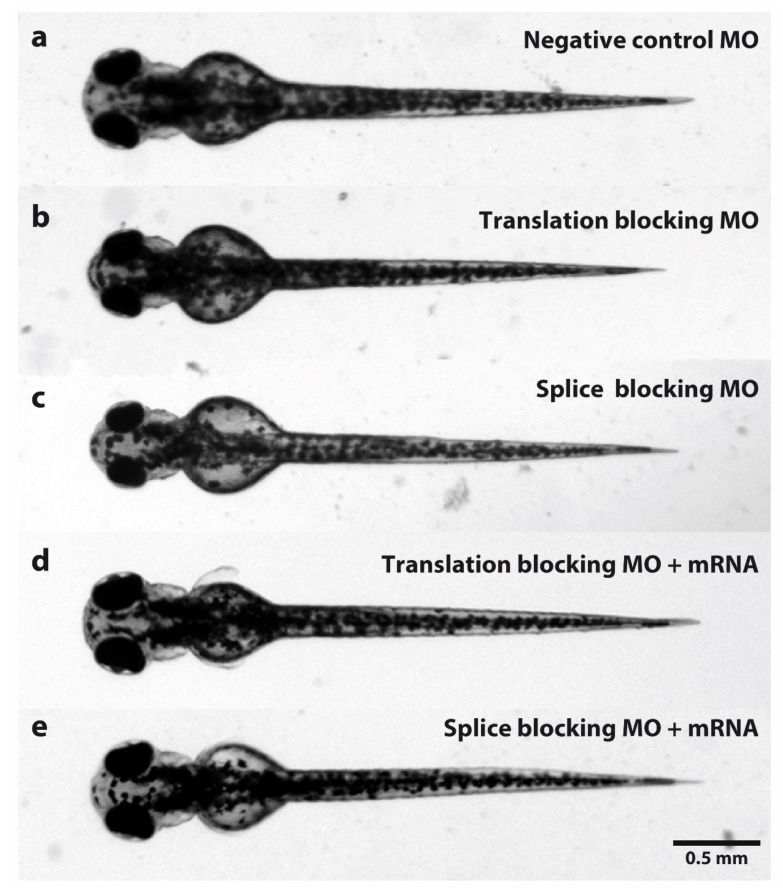
Dorsal view comparison of zebrafish larvae at 3 dpf injected with MOs. (a) Standard control oligo was injected as a negative control. (b) Zebrafish larvae injected with tubgcp2 translation-blocking MO. (c) Zebrafish larvae injected with tubgcp2 splice-blocking MO. (d) Zebrafish larvae co-injected with tubgcp2 translation-blocking MO and tubgcp2 wild type mRNA. (e) Zebrafish larvae co-injected with tubgcp2 splice MO and tubgcp2 wild type mRNA.
Figure Data
Acknowledgments
This image is the copyrighted work of the attributed author or publisher, and
ZFIN has permission only to display this image to its users.
Additional permissions should be obtained from the applicable author or publisher of the image.
Full text @ Cells