Image
Figure Caption
Fig 4
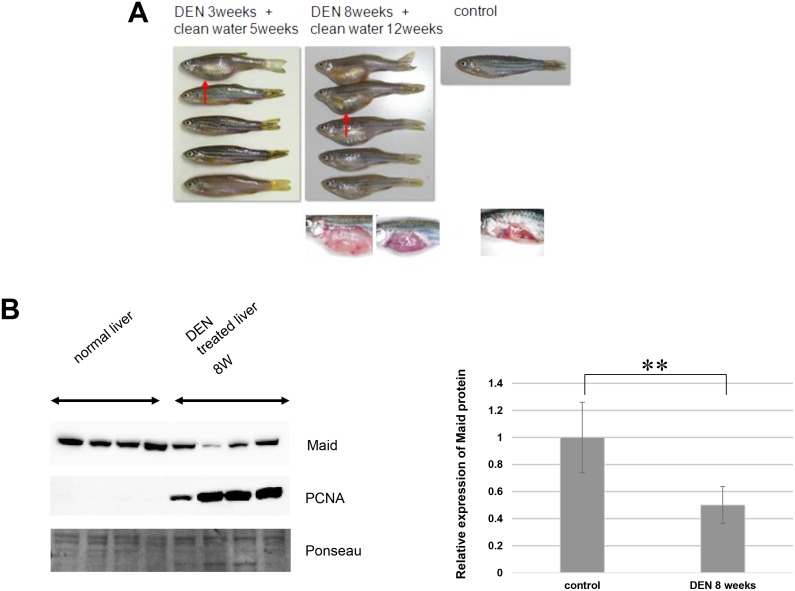
(A) Top left: Macroscopic views of zebrafish in Group 1. Red arrow indicates a distended abdomen. Top middle: Macroscopic views of zebrafish in Group 2. Top right: Macroscopic view of a control zebrafish reared for 5 weeks in clean water and not exposed to DEN. Bottom panels show macroscopic views of (middle) livers of two DEN-treated zebrafish in Group 2 and (right) healthy control liver. (B) Western blot analysis of Maid and PCNA protein in two normal zebrafish livers and livers of 5 zebrafish subjected to 8 weeks of DEN administration. Left: Graphical representation of Western blot analysis, **, p<0.01.
Acknowledgments
This image is the copyrighted work of the attributed author or publisher, and
ZFIN has permission only to display this image to its users.
Additional permissions should be obtained from the applicable author or publisher of the image.
Full text @ PLoS One

