
Fig. 4
- ID
- ZDB-IMAGE-220909-19
- Publication
- Luo et al., 2022 - Identification and functional characterization of BICD2 as a candidate disease gene in an consanguineous family with dilated cardiomyopathy
- All Figures
- Figures for Luo et al., 2022
|
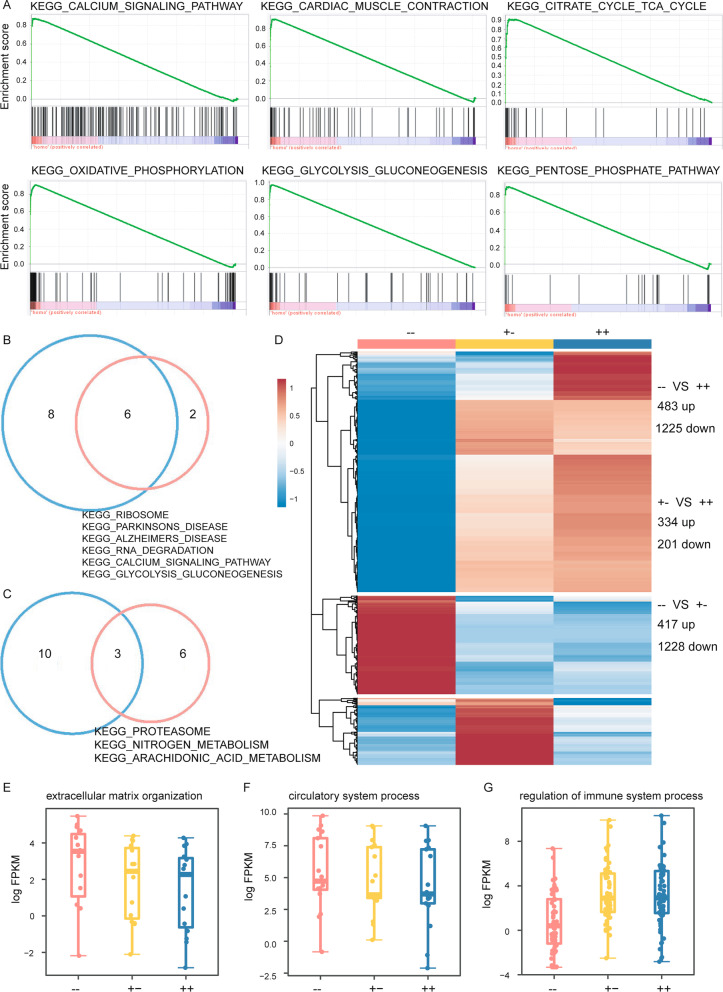
Fig. 4
bicd2-deficient hearts exhibited cardiac transcriptome shift. A. GSEA plots of six KEGG pathways showing higher expression in bicd2 zebrafish. B. Venn diagrams showing enriched KEGG pathways among genes with increased expression in the bicd2-deficient groups. C. Venn diagrams showing enriched KEGG pathways among genes with decreased expression in the bicd2-deficient groups. D. Differentially expressed genes in the two bicd2-deficient groups. Cells are filled according to z score: red indicates higher (activated), blue indicates lower (inhibited). E. Differentially expressed genes involved in extracellular matrix organization. Cells are filled according to z score: red indicates higher (activated), blue indicates lower (inhibited). F. Differentially expressed genes involved in circulatory system processes. Cells are filled according to z score: red indicates higher (activated), blue indicates lower (inhibited). G. Differentially expressed genes involved in the regulation of immune system processes. Cells are filled according to z score: red indicates higher (activated), blue indicates lower (inhibited)