Fig. 3
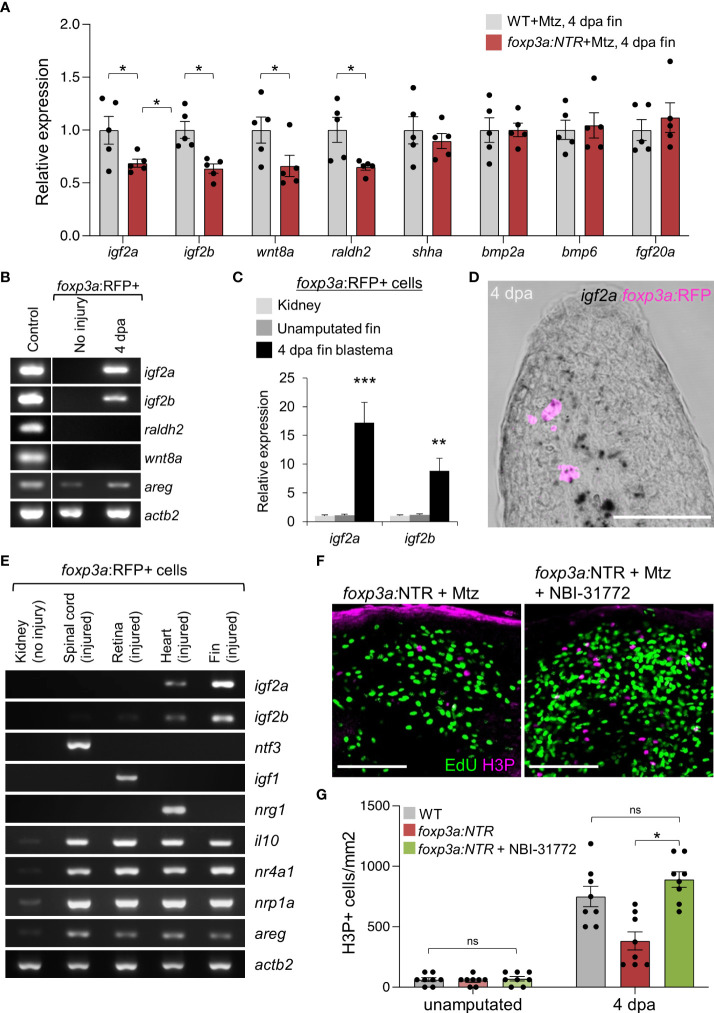
Blastemal cell proliferation during caudal fin regeneration is regulated by Treg cells-derived pro-regenerative factors. (A) qRT-PCR analysis of growth factors expression in 4 dpa fin blastema of wild-type and foxp3a:NTR fish after Mtz treatment. (mean ± SEM, n = 5, Student’s T-test). (B) RT-PCR analysis of growth factors expression (found significant decrease after Treg cell ablation) from purified foxp3a:RFP+ cells from unamputated and 4 dpa fin blastema. The 4 dpa fin blastema tissue was used as control. (C) Expression analysis of igf2a and igf2b in purified foxp3a:RFP+ cells from kidney marrow, unamputated fin and 4 dpa fin blastema. (mean ± SEM, n = 5, Student’s T-test). (D) In situ hybridization using RNAscope and immunofluorescence against TagRFP showing igf2a mRNA expression within infiltrated foxp3a:RFP+ cells of a 4 dpa fin blastema. (E) RT-PCR analysis of growth factor expression of purified foxp3a:RFP+ cells from kidney, 7 days post injured (dpi) spinal cord, 4 dpi retina, 7 dpi heart, and 4 dpa fin blastema tissues show tissue-specific growth factor secretion pattern of Treg cells. (F) The wholemount preparation of 4 dpa fin with EdU and H3P immunostaining in Treg ablated fish and fish with NBI-31772 application after Treg ablation. EdU was injected intraperitoneally at 30 min before fin tissue collection. (G) Quantification of H3P+ cells in unamputated and 4 dpa fin blastema of wild-type, Treg ablated fish, and fish with NBI-31772 application after Treg ablation (mean ± SEM, n = 8-9, Mann–Whitney U test). *P < 0.01; **P < 0.001; ***P < 0.0001; ns, not significant; Mtz, metronidazole; NTR, nitroreductase; Sacle Bars, 50 mm.

