
|
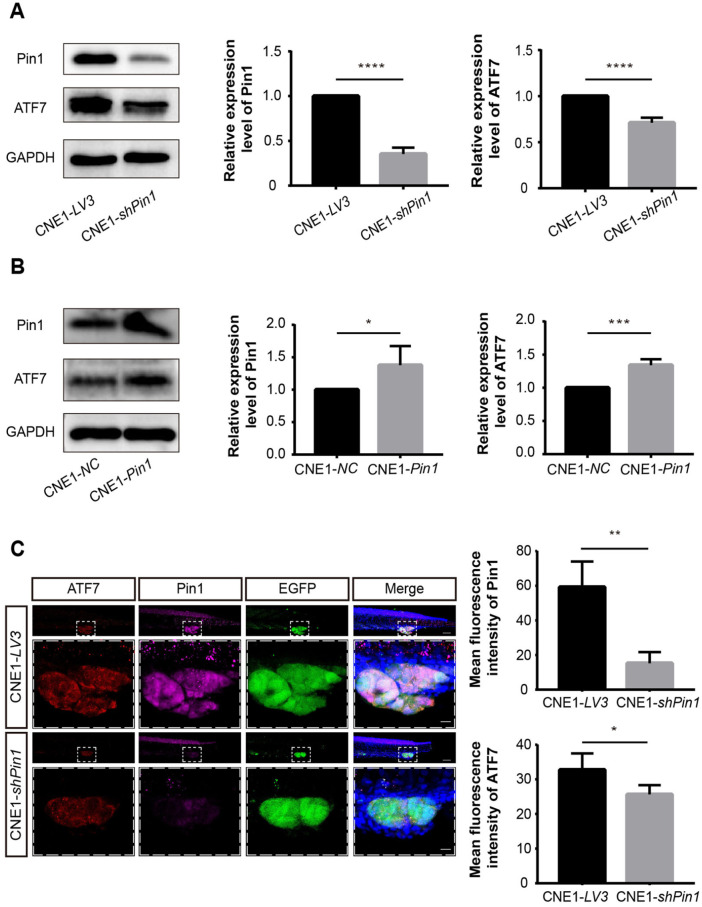
Fig. 5
The expression of ATF7 was correlated with the expression of Pin1. (A-B) Western blot analysis was used to detect the expression of ATF7 in Pin1-knockdown or Pin1-overexpressed CNE1 cells. The relative expression levels of Pin1 and ATF7 were quantified (n = 4 independent repeats). (C) Whole-mount embryo immunofluorescence staining of ATF7 expression in tumor cells transplanted in zebrafish. Images of selected areas (white dashed line) are shown at higher magnification below. Scale bar: 50 μm; 10 μm in the amplified image. The mean fluorescence intensity of Pin1 and ATF7 was analyzed quantitatively. The data were quantitatively analyzed by Student’s t test (CNE1-LV3 group, n = 5 transplanted fishes analyzed; CNE1-shPin1 group, n = 3 transplanted fishes analyzed). Data are shown as mean ± SD. GAPDH: glyceraldehyde-3-phosphate dehydrogenase; EGFP: enhanced green fluorescent protein. *P < 0.05; **P < 0.01; ***P < 0.001; ****P < 0.0001.