
|
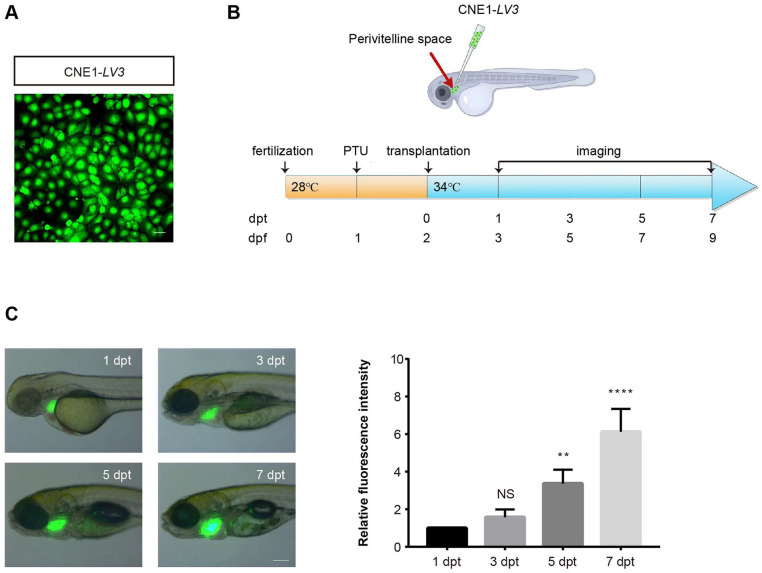
Fig. 1
Xenograft of human nasopharyngeal carcinoma CNE1 cells in zebrafish. (A) Expression of GFP after transfection was detected in the stabilized cell line of CNE1 cells. Scale bar: 50 μm. (B) Top: diagram of the establishment of zebrafish xenograft model. Bottom: experimental protocol. (C) Left: xenograft model of zebrafish at 1, 3, 5, and 7 dpt. Fluorescent and bright fields are merged, respectively. Scale bar: 1 mm. Right: the relative fluorescence intensity of tumor cells transplanted into zebrafish was quantified. The quantity of tumor cells at 1 dpt was used as the baseline, with which the quantity of tumor cells at other time points was compared. Data were quantitatively analyzed using one-way ANOVA (n = 4 fishes analyzed). Data are shown as mean ± SD. GFP: green fluorescent protein; PTU: phenylthiourea; dpt: days post-transplantation; dpf: days post-fertilization; NS: not significant. **P < 0.01; ****P < 0.0001.