
|
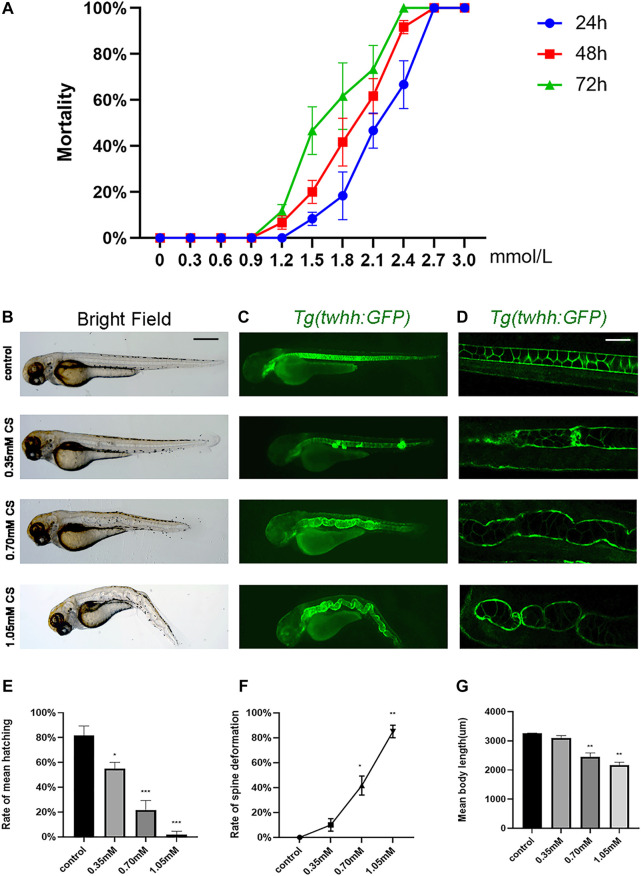
Fig. 1
The phenotype of skeletal development defects in embryos after cysteamine exposure. (A) The cumulative mortality rate of zebrafish exposed from 0 to 3.0 mM cysteamine at 24, 48 and 72 hpf. (B–D) Microscopic imaging of Tg (twhh: GFP) zebrafish larvae exposed to 0.35, 0.70, and 1.05 mM cysteamine at 72 hpf. (E) The hatching rate of zebrafish exposed to 0.35, 0.70, and 1.05 mM cysteamine at 72 hpf. (F) The deformation rate of zebrafish exposed to 0.35, 0.70, and 1.05 mM cysteamine at 72 hpf. (G) The body length of zebrafish larvae exposed to 0.35, 0.70, and 1.05 mM cysteamine at 72 hpf. Scale bars: 100 μ (B,C), 50 μm (D). *p < 0.05, **p < 0.01, ***p < 0.001, mean ± S.D.