
Fig. 3
- ID
- ZDB-IMAGE-220906-21
- Publication
- Zhang et al., 2022 - Identification of Scd5 as a functional regulator of visceral fat deposition and distribution
- All Figures
- Figures for Zhang et al., 2022
|
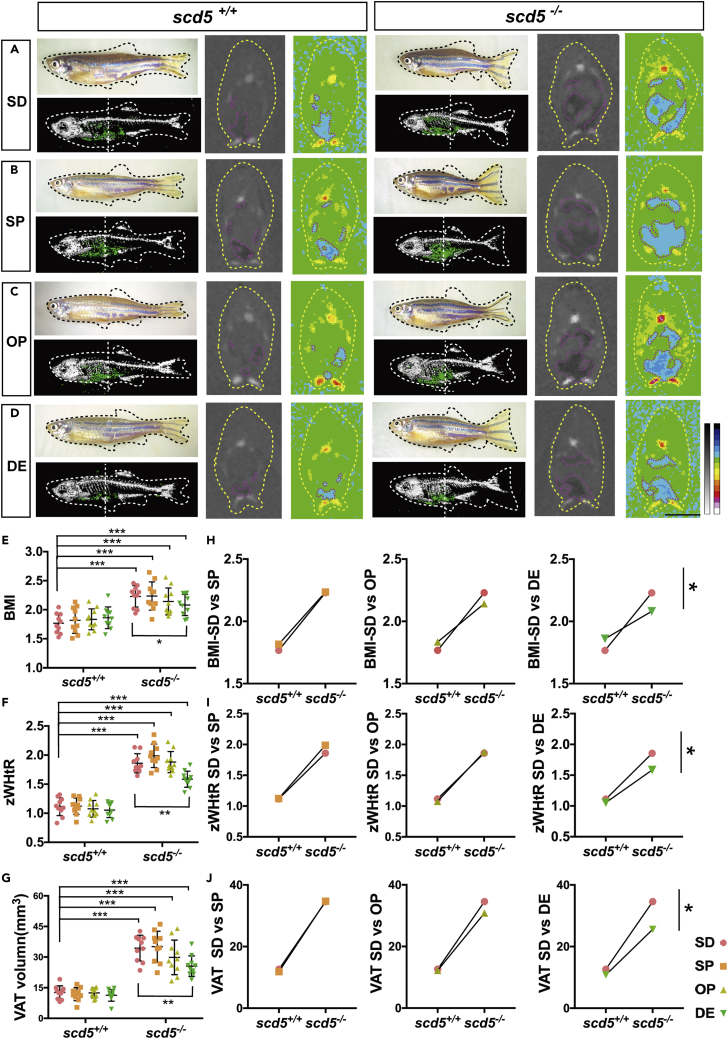
Fig. 3
ω3-PUFA significantly rescued the ectopic adipose deposition of scd5 mutant
(A–D) Appearance view, the 3D reconstruction, and section view of micro-CT scans on four different dietary supplementations fed scd5+/+ and scd5−/− zebrafish. White dotted vertical line indicates sectional position, blue area indicates adipose tissues. Scale bar = 2mm.
(E–G) Data statistics on BMI, zWHtR, and VAT volumes of standard diet (SD), SD plus SFA (SP), SD plus MUFA (OP), and SD plus ω3-PUFA (DE) groups. Data are represented as mean ± SD two-way ANOVA results of every groups compared to scd5+/+ -SD were shown, and the simple effects within the same genotypes were also shown. H-J, two-way ANOVA results of three diets vs control for scd5+/+ and scd5−/−. ∗p < 0.05, ∗∗p < 0.01, ∗∗∗p < 0.001 represents statistical significance of interaction between genotype and dietary. n = 10 for each group.