
|
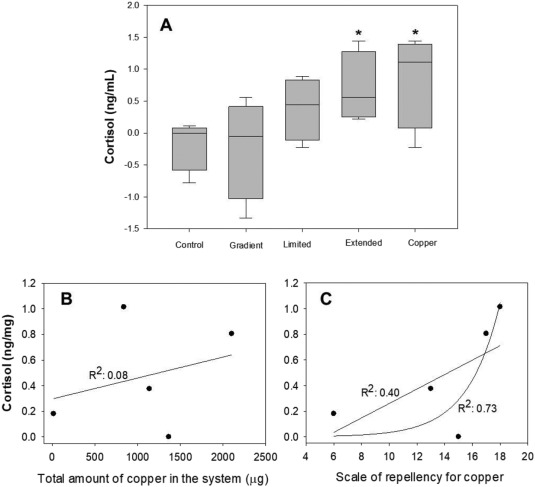
Fig. 3 Boxplot of the levels of whole-body cortisol of zebrafish populations (n = 4) exposed to different copper contamination scenarios (A – see details of scenarios in Material and Methods). The asterisks represent statistically significant differences in the cortisol levels of the treatments (populations in different environmental scenarios) compared to the control population according to the unpaired t-test with Welch correction. The relationship between stress (cortisol levels) and the copper contamination considering the total amount of copper in the system (B – sum of the copper detected in all the compartments of the system) and the scale of the repellency of copper based on the probability of triggering avoidance (C – here ACs values were taken as the reference – see Materials and Methods for details).