
Fig. 2
- ID
- ZDB-IMAGE-220905-41
- Publication
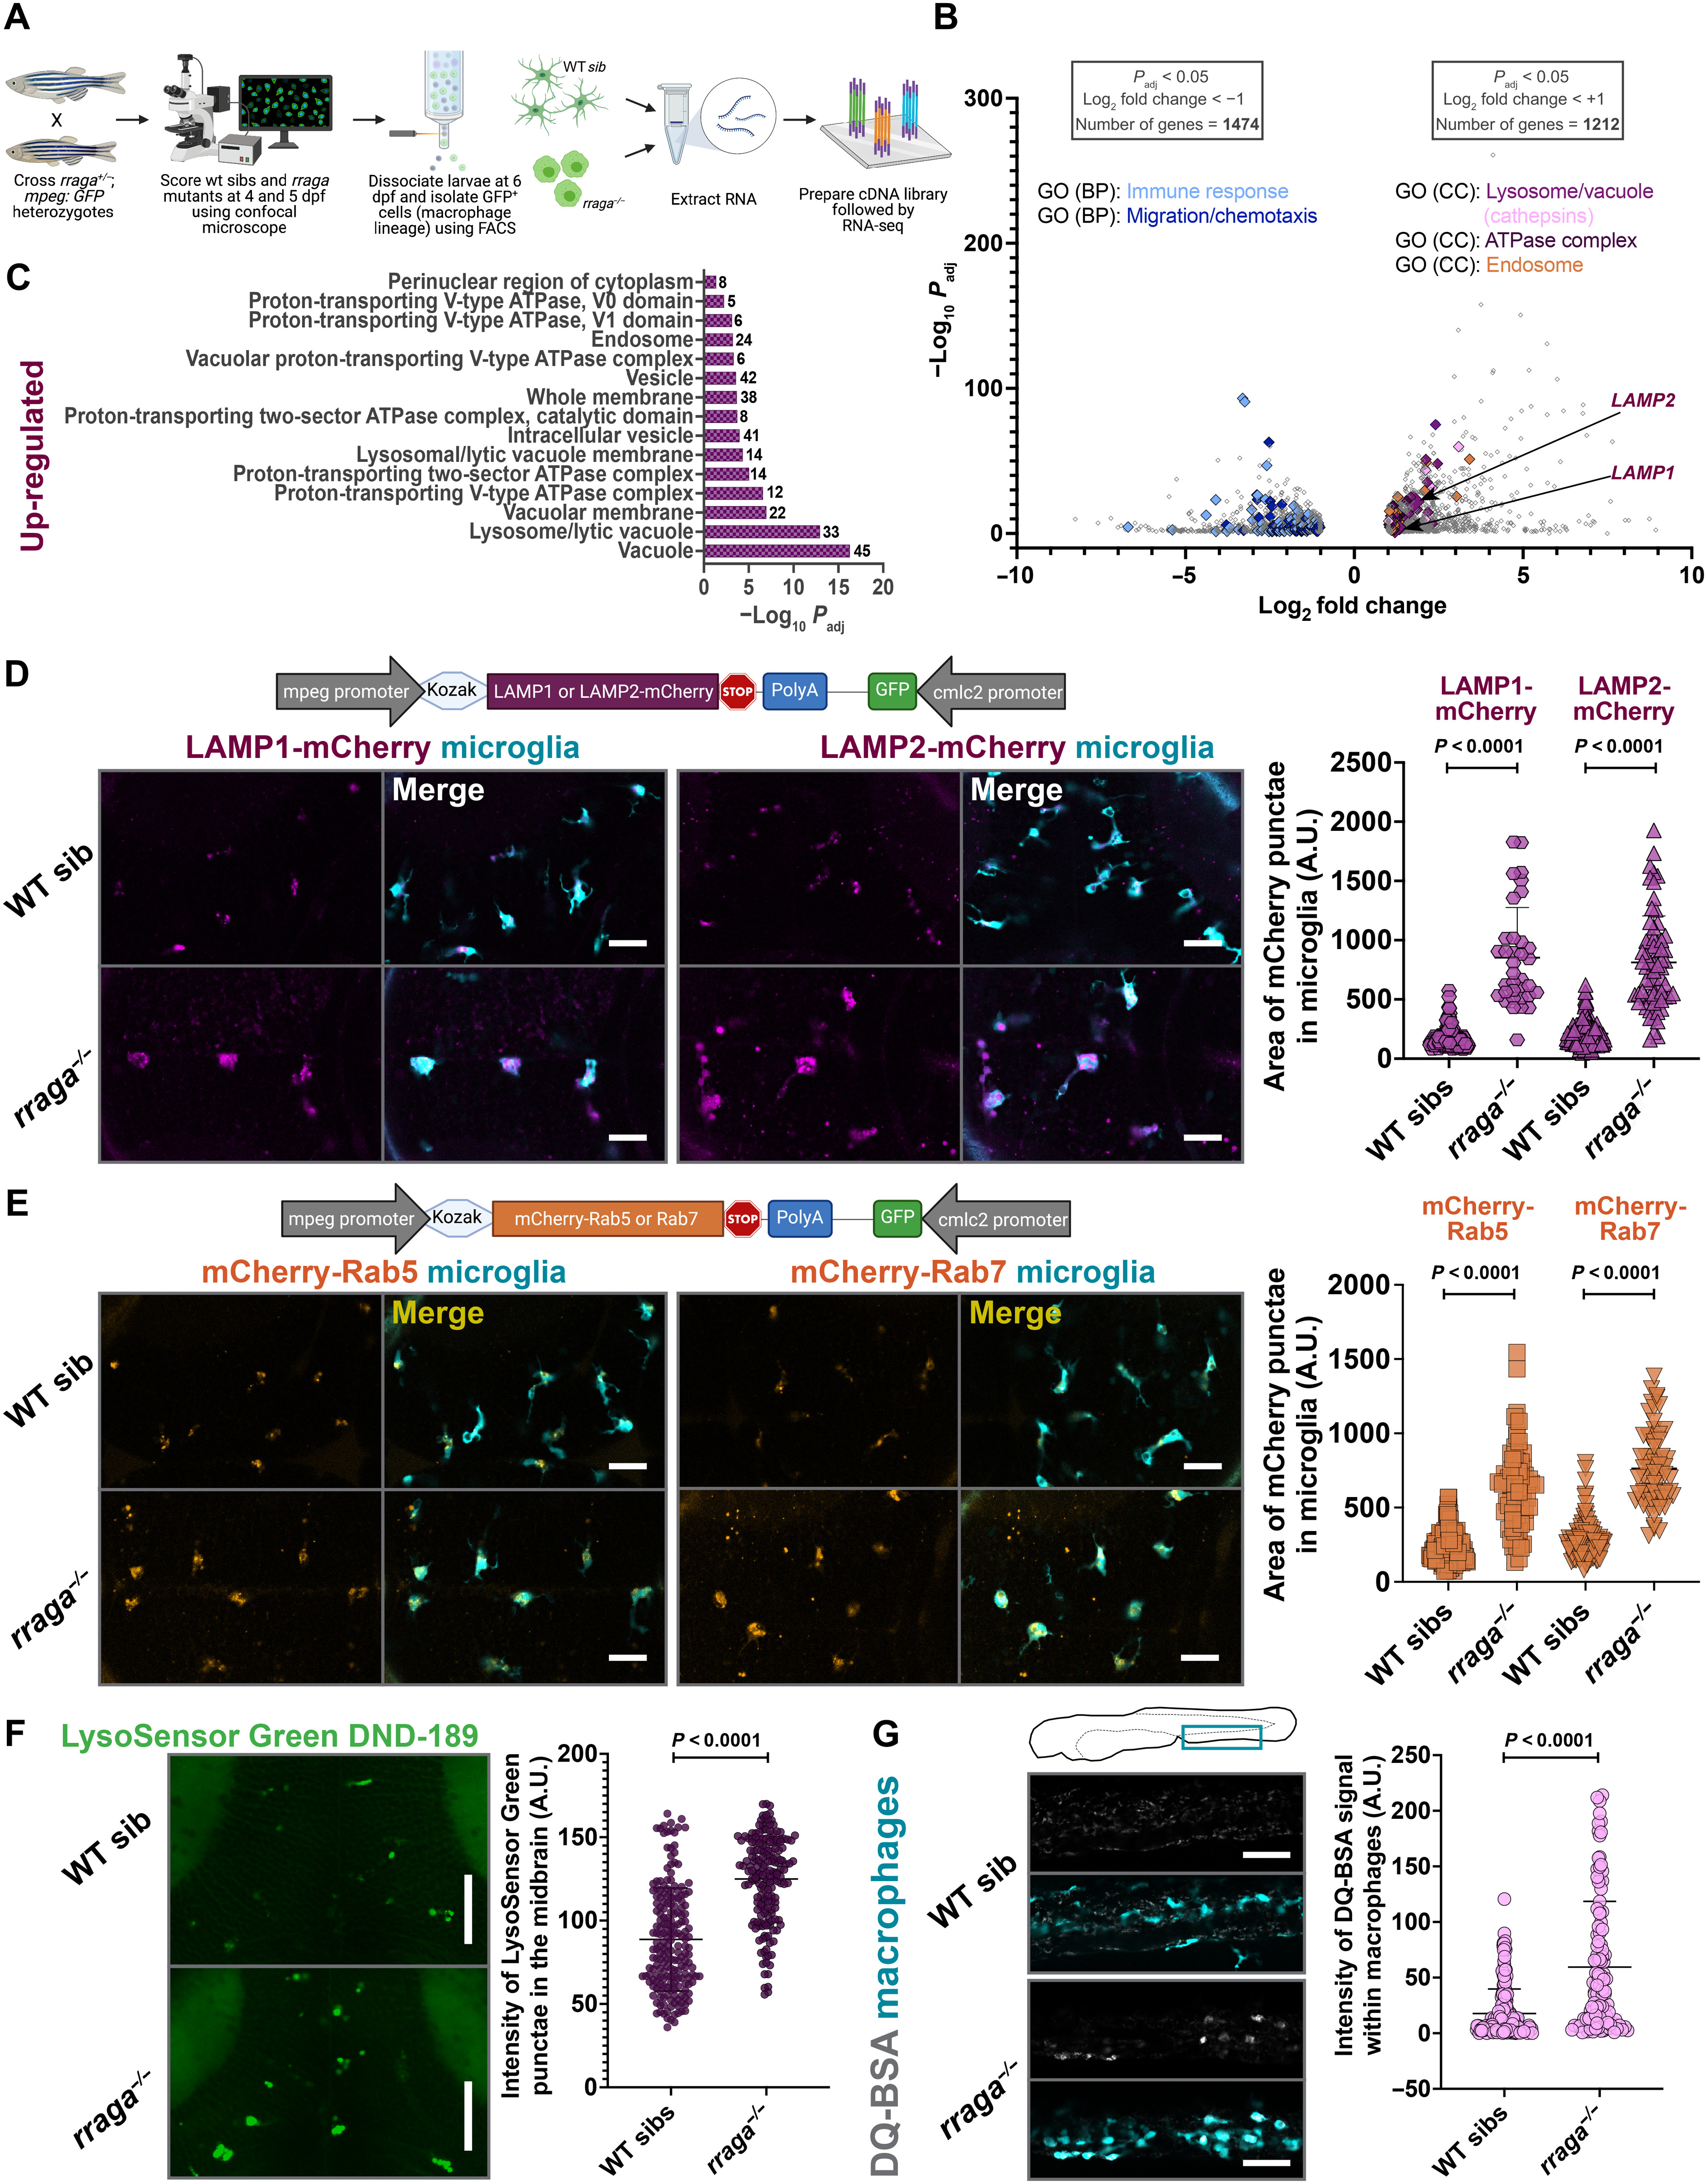
- Iyer et al., 2022 - A lysosomal regulatory circuit essential for the development and function of microglia
- All Figures
- Figures for Iyer et al., 2022
|
Fig. 2