
IMAGE
Fig. 3
- ID
- ZDB-IMAGE-220905-32
- Publication
- Moog et al., 2022 - Clemizole and Trazodone are Effective Antiseizure Treatments in a Zebrafish Model of STXBP1 Disorder
- All Figures
- Figures for Moog et al., 2022
Image
|
Figure Caption
Fig. 3
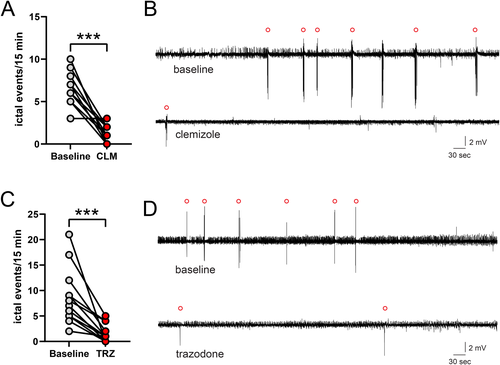
Effect of clemizole and trazodone on ictal-like seizure events in stxbp1b mutant zebrafish. A, Individual value plot of ictal event frequency at baseline (0–15 min) and 45–60 min after continuous bath application of 1 mM clemizole (CLM, n = 11). Independent experiment pairs are indicated by the connected line. ***P < .0001. B, Representative 60-min local field potential (LFP) traces for stxbp1b mutant zebrafish at baseline (6.5 ± 0.6 events/15 min) and 45–60 min after clemizole exposure (1.3 ± 0.3 events/15 min). Ictal events are noted by open red circles above traces. C, Individual value plot of ictal event frequency at baseline (0–15 min) and 45–60 min after continuous bath application of 1 mM trazodone (TRZ, n = 14). Independent experiment pairs are indicated by the connected line. ***P < .0001. D, Representative 60-min LFP traces for stxbp1b mutant zebrafish at baseline (8.2 ± 1.4 events/15 min) and 45–60 min after trazodone exposure (1.4 ± 0.4 events/15 min). Ictal events are noted by open red circles above traces. Student’s unpaired t tests
Figure Data
Acknowledgments
This image is the copyrighted work of the attributed author or publisher, and
ZFIN has permission only to display this image to its users.
Additional permissions should be obtained from the applicable author or publisher of the image.
Full text @ Epilepsia Open